Projects

Professional Photography Portfolio Website
A web app featuring my professional photography portfolio.

(In-Progress) Park Compass
An interactive web app featuring personalized AI-generated park itineraries, dashboards, and trip documentation.
Quantum Machine Learning for Leukemia Genomics
Engineered quantum and classical ML models to classify leukemia subtypes from gene-expression data.
Risk Radar: Tweet Analysis for Disaster Crisis Response
Developed a near real-time crisis detection system using the Bluesky API, benchmarking LLMs to classify 25K+ disaster-related posts.

L3 Rocket - Simulation Lead; Spaceport America Cup
Designed & launched a high-powered rocket, leading flight simulations and 6-DOF analyses to optimize performance.
Variational Quantum Eigensolver Implementation - H2
An implementation of the hybrid quantum algorithm VQE for calculating the ground state of the transverse Ising model.
E91 QKD Protocol Implementation
An implementation of the Ekert 91 Quantum Key Distribution Protocol.
JD Photography
May 2026 | Personal Project
Overview
This website is home to my professional photography portfolio. I wanted to make a website where anyone can view my portfolio, but I didn't want to pay for a website service, so I made it myself! This also allowed me to get more practice in with React and Tailwind v4.
Tech Stack
Frontend framework
For scripting/functionality features
v4; Customized UI components
Build tool; development server
Cloud-based deployment
Park Compass
April 2026 - Present | Personal Project
Overview
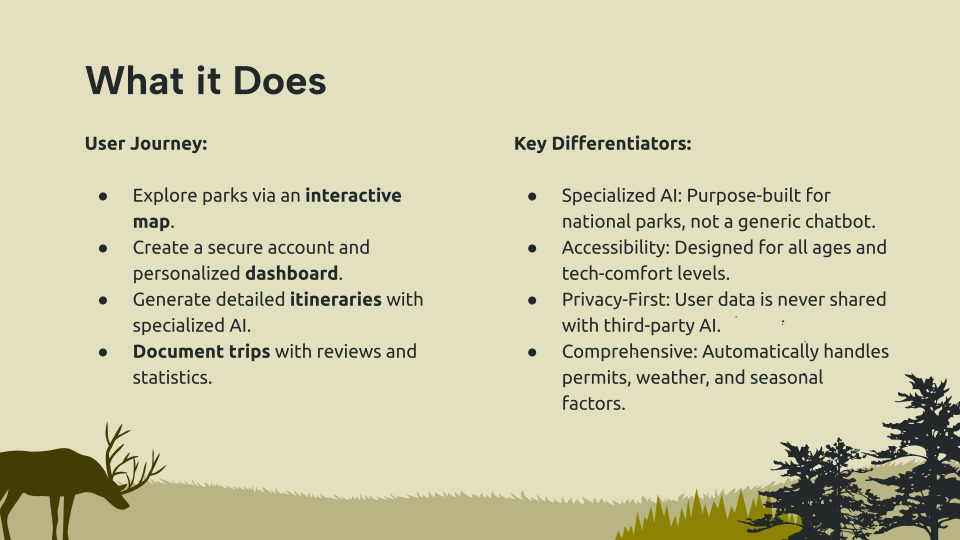
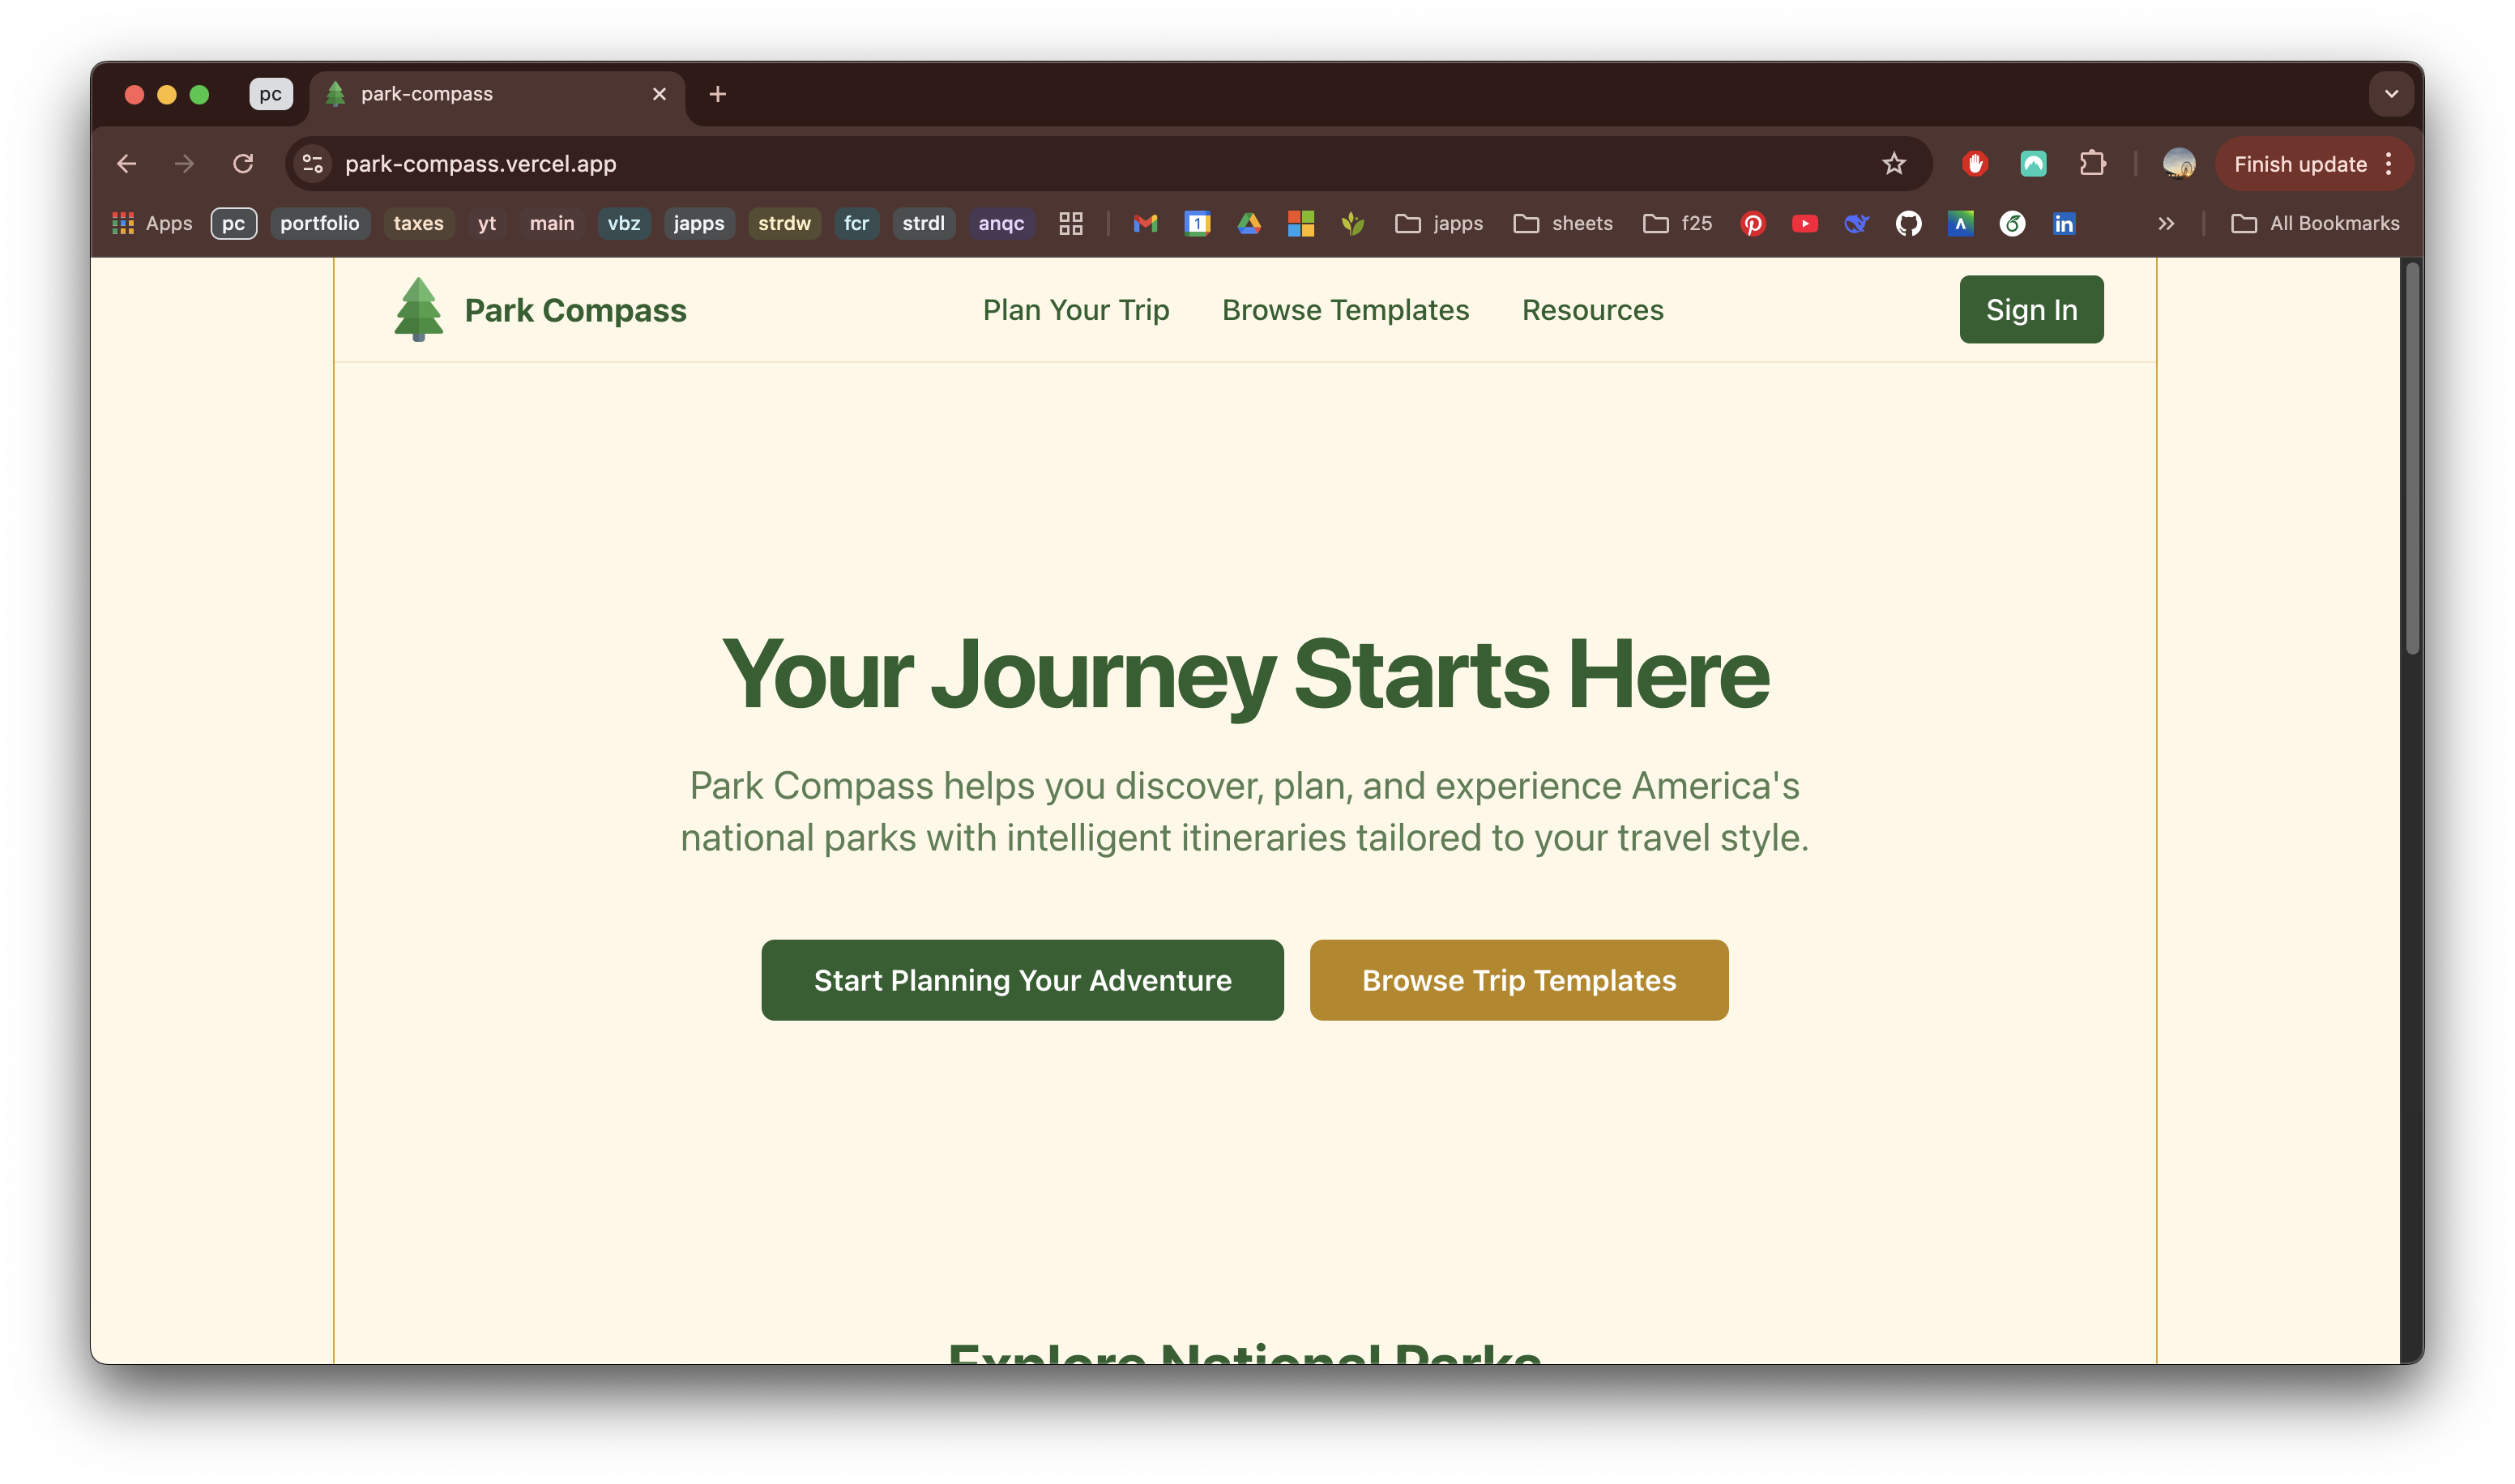
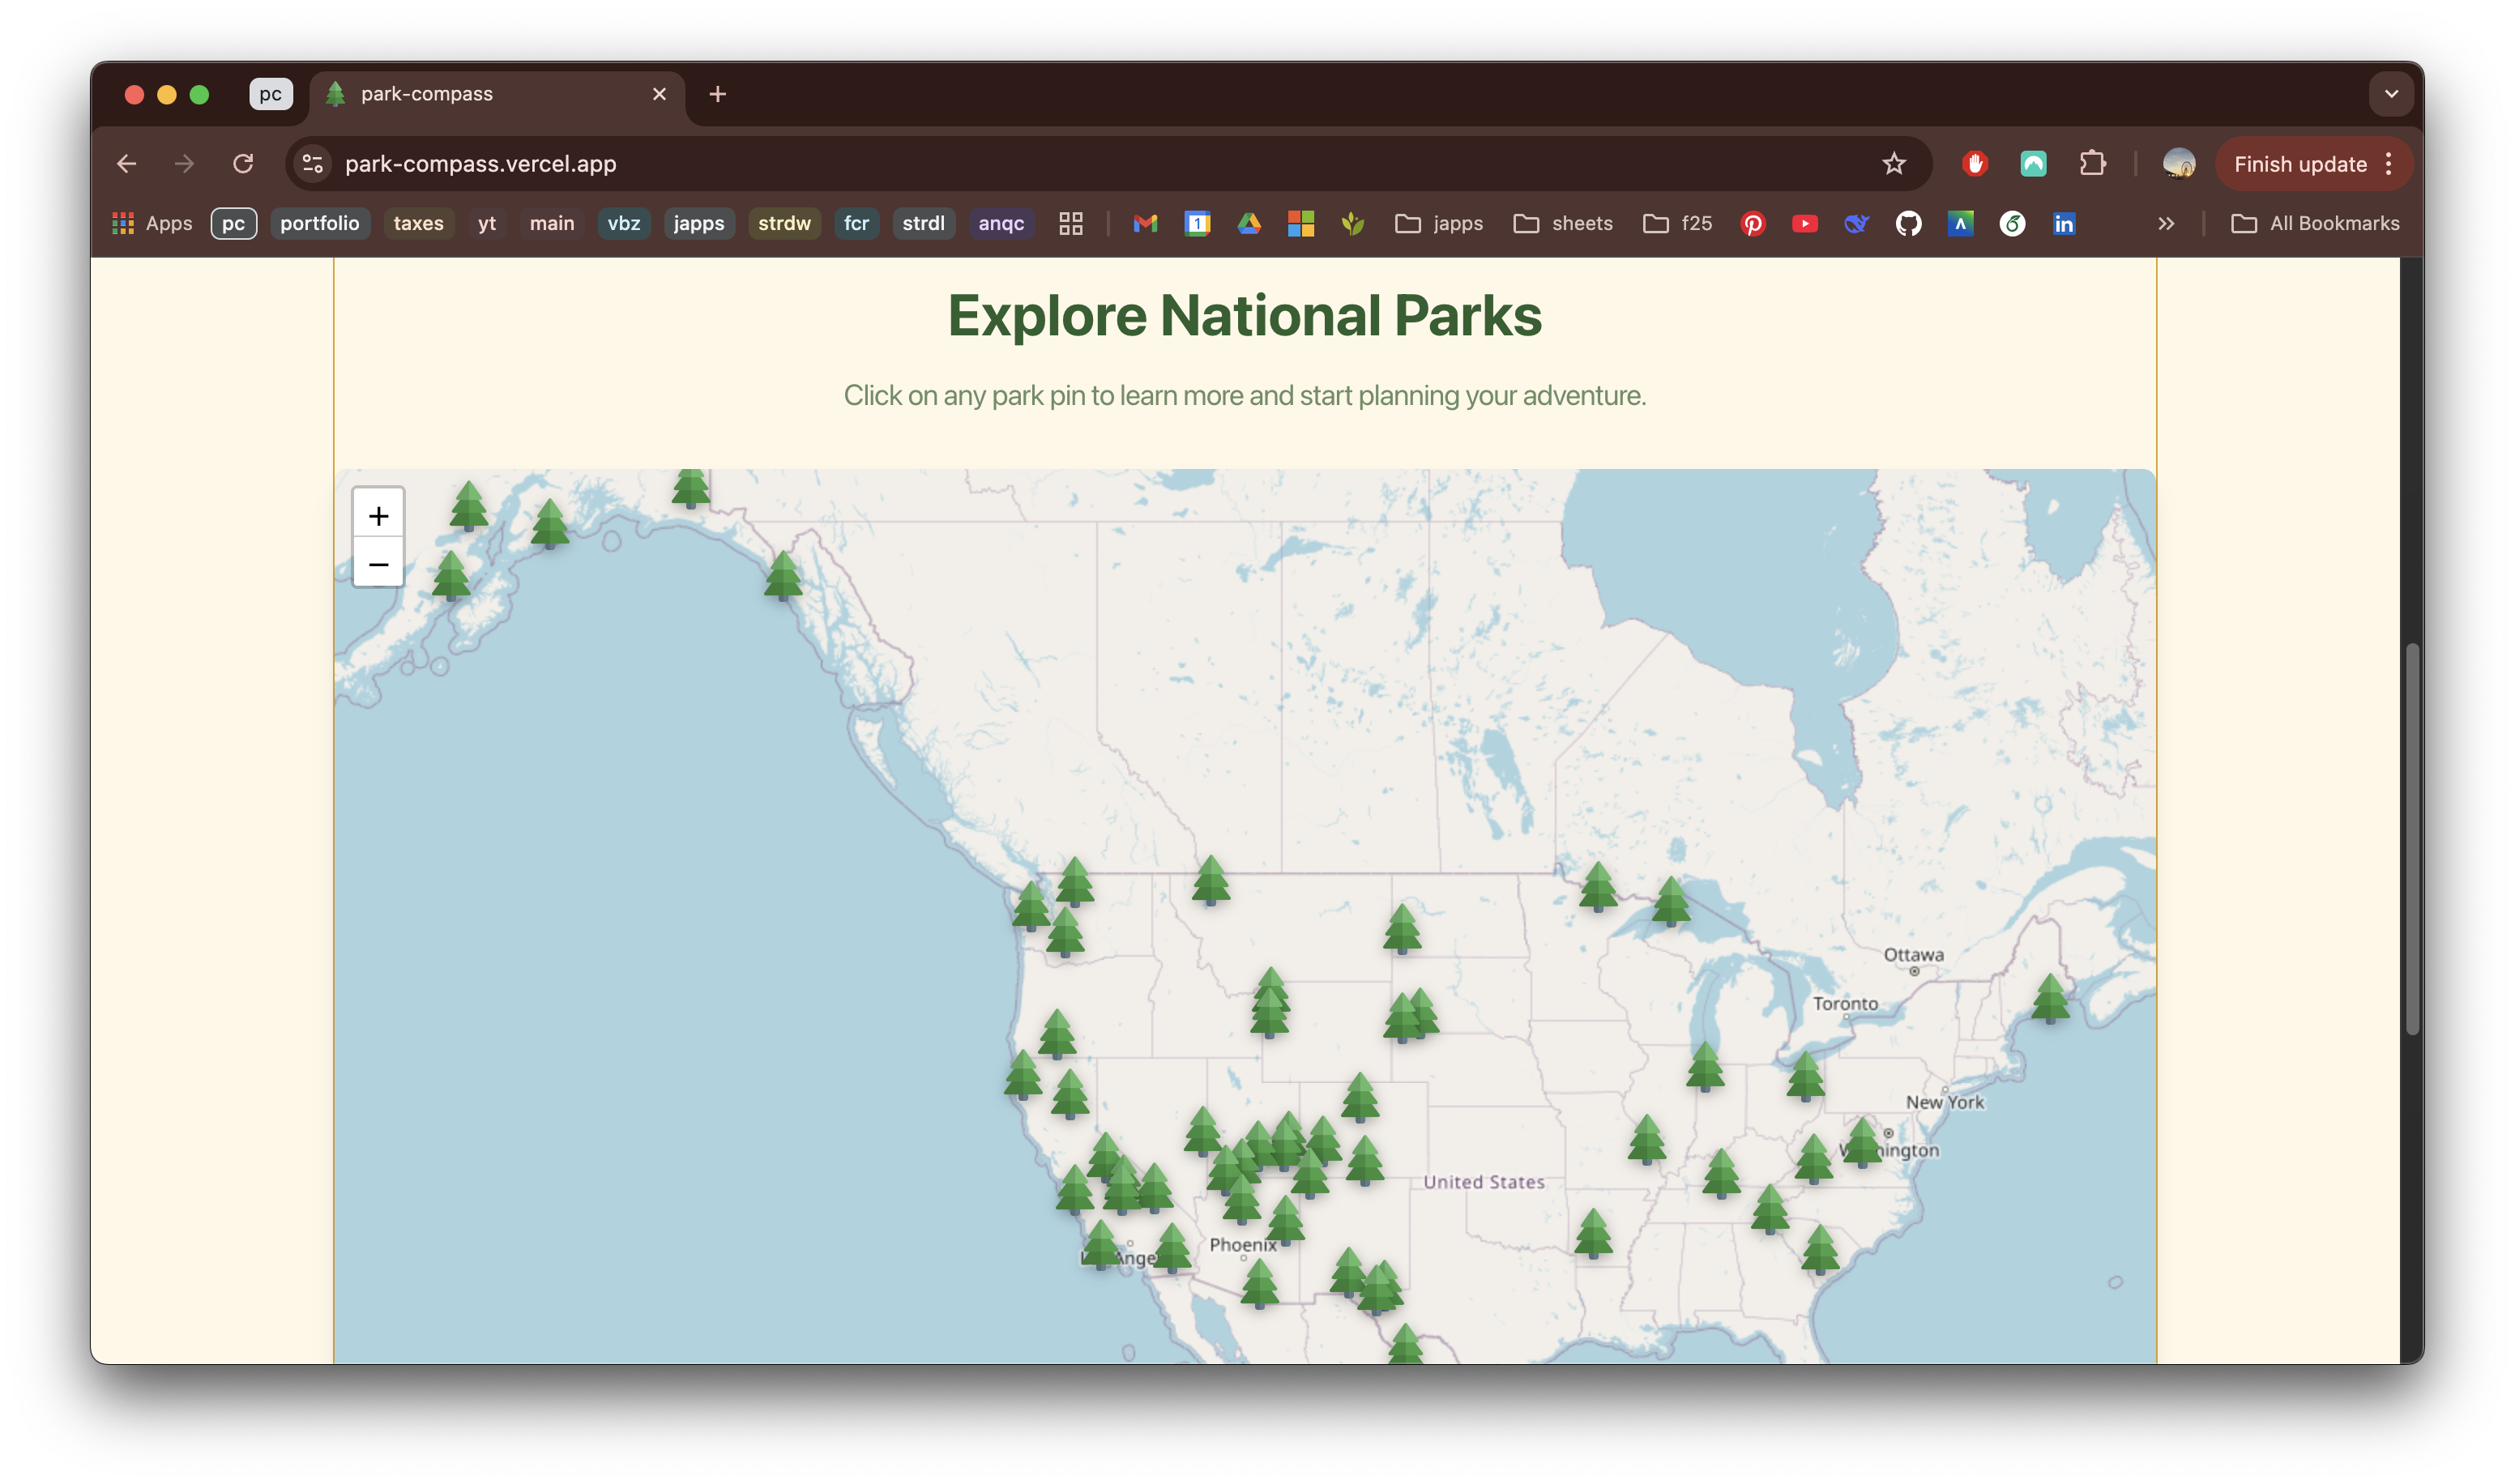
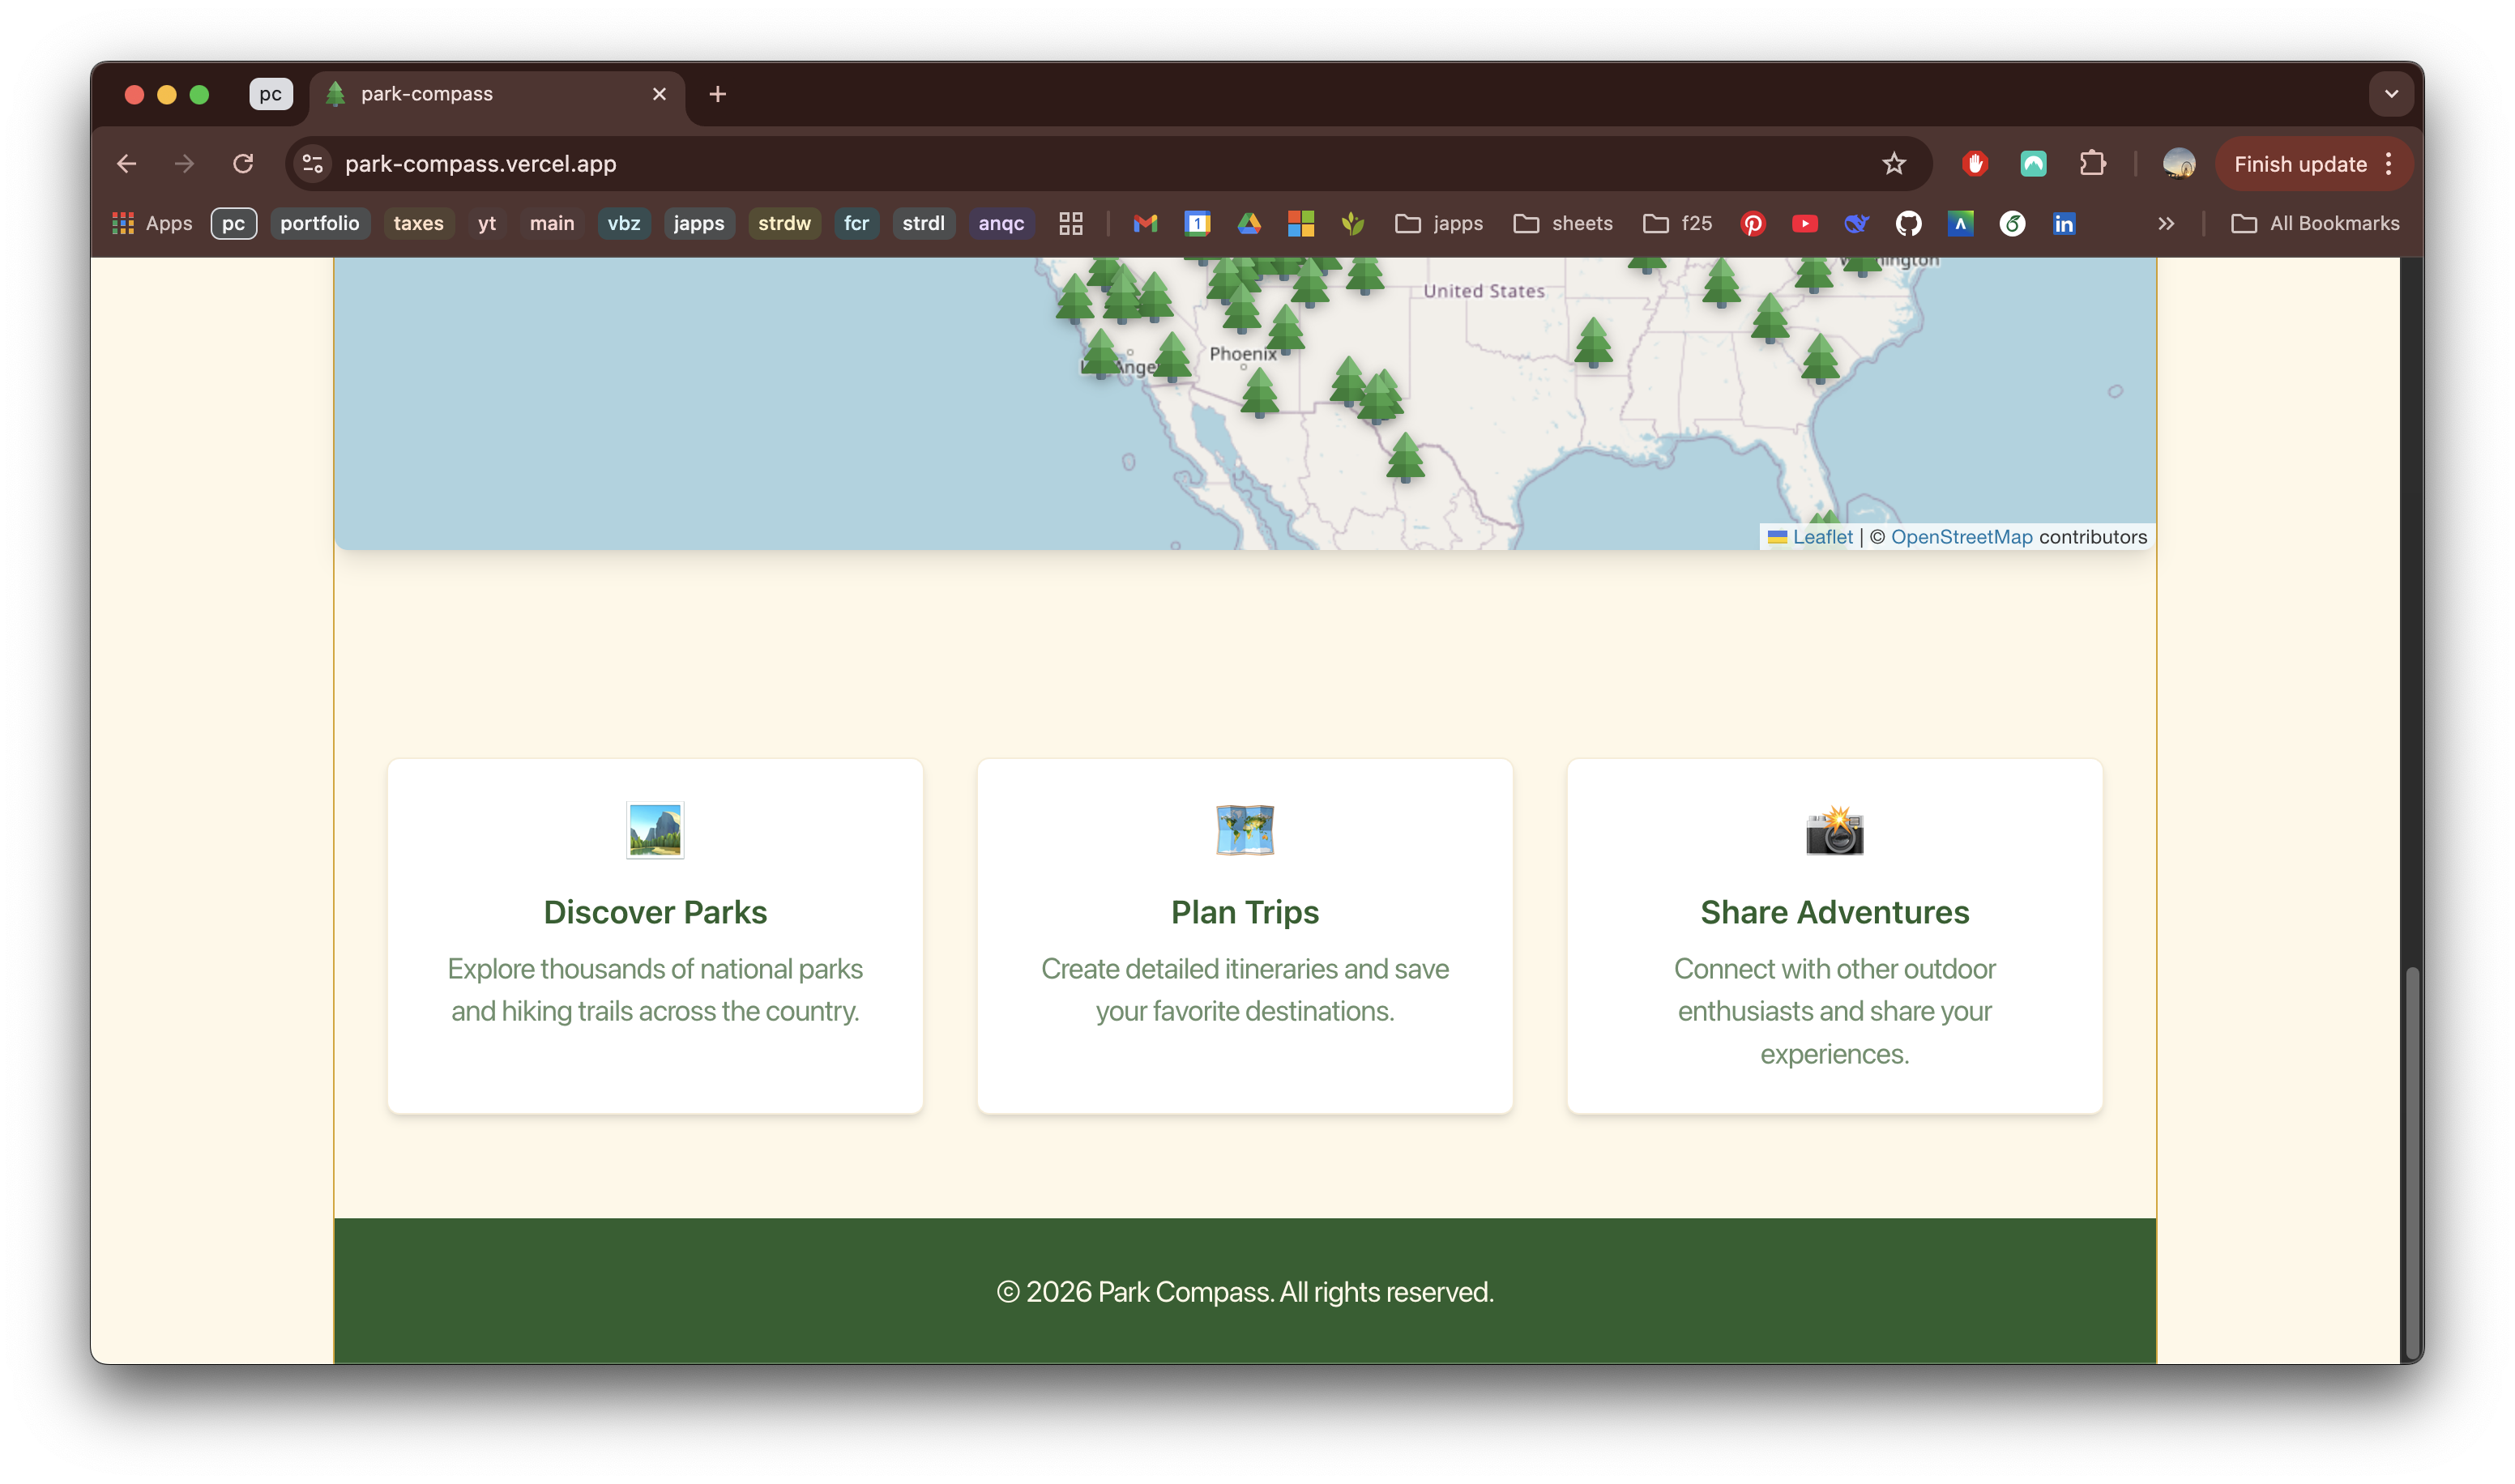
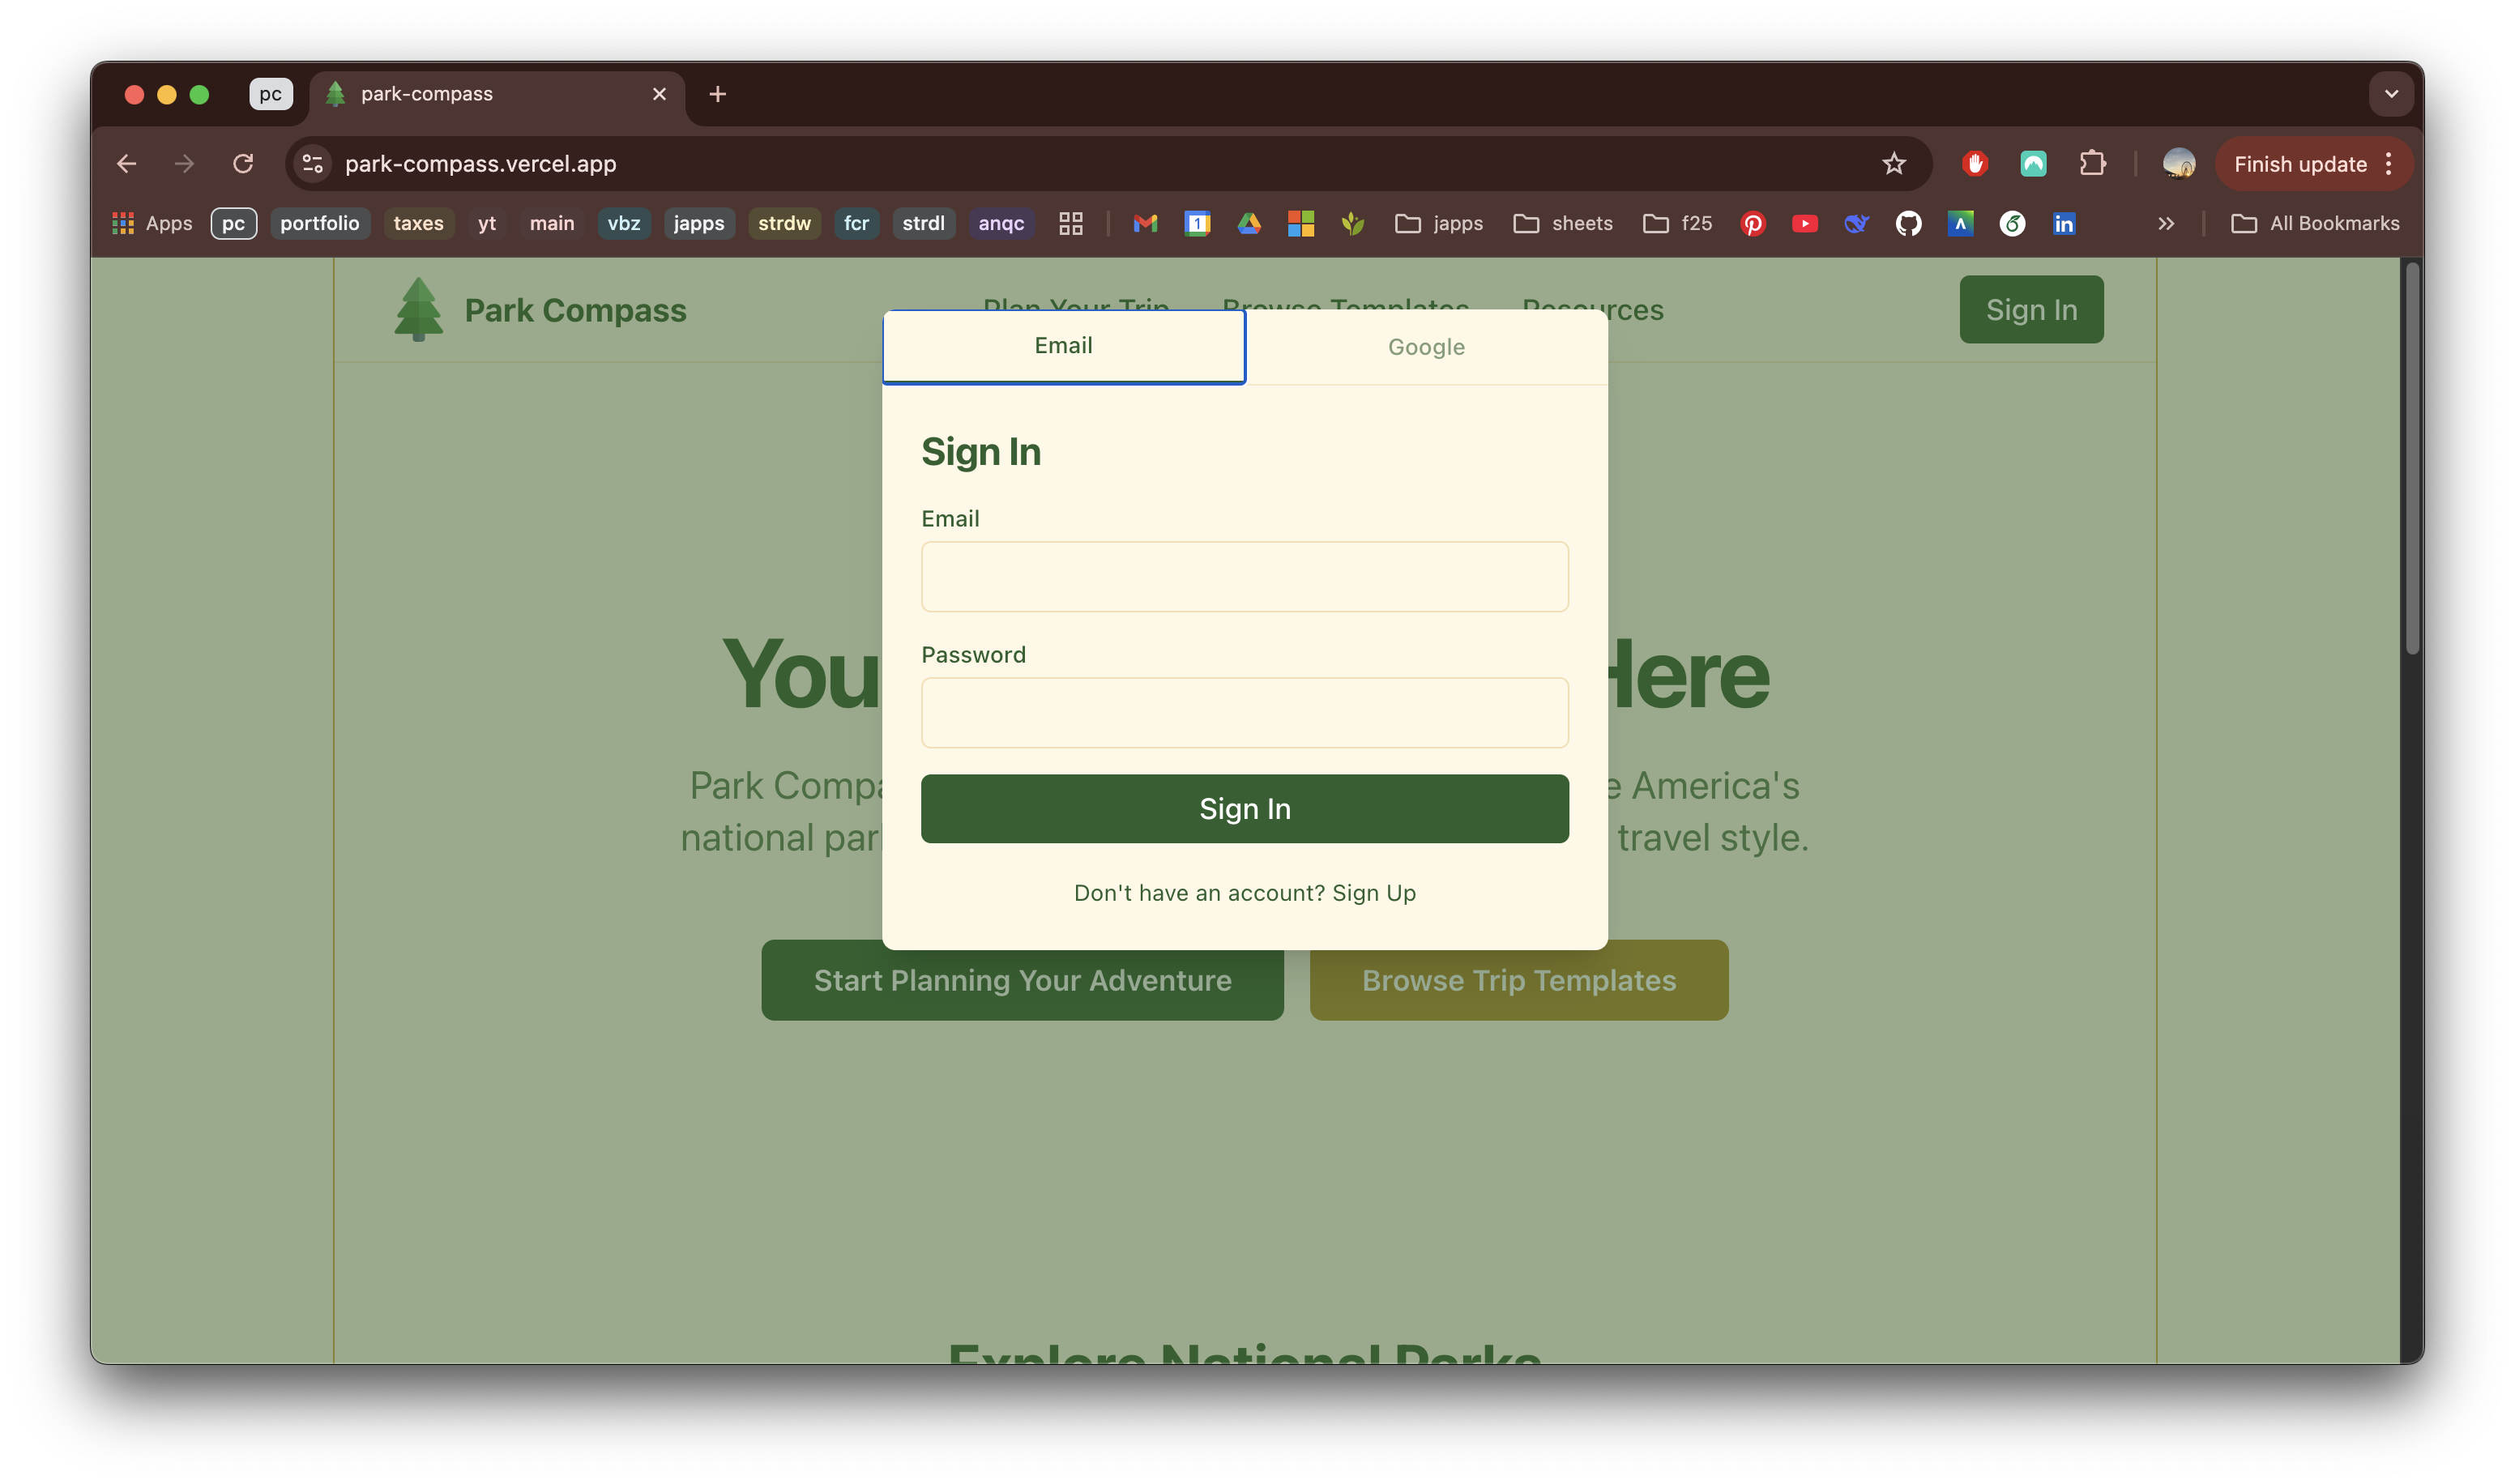
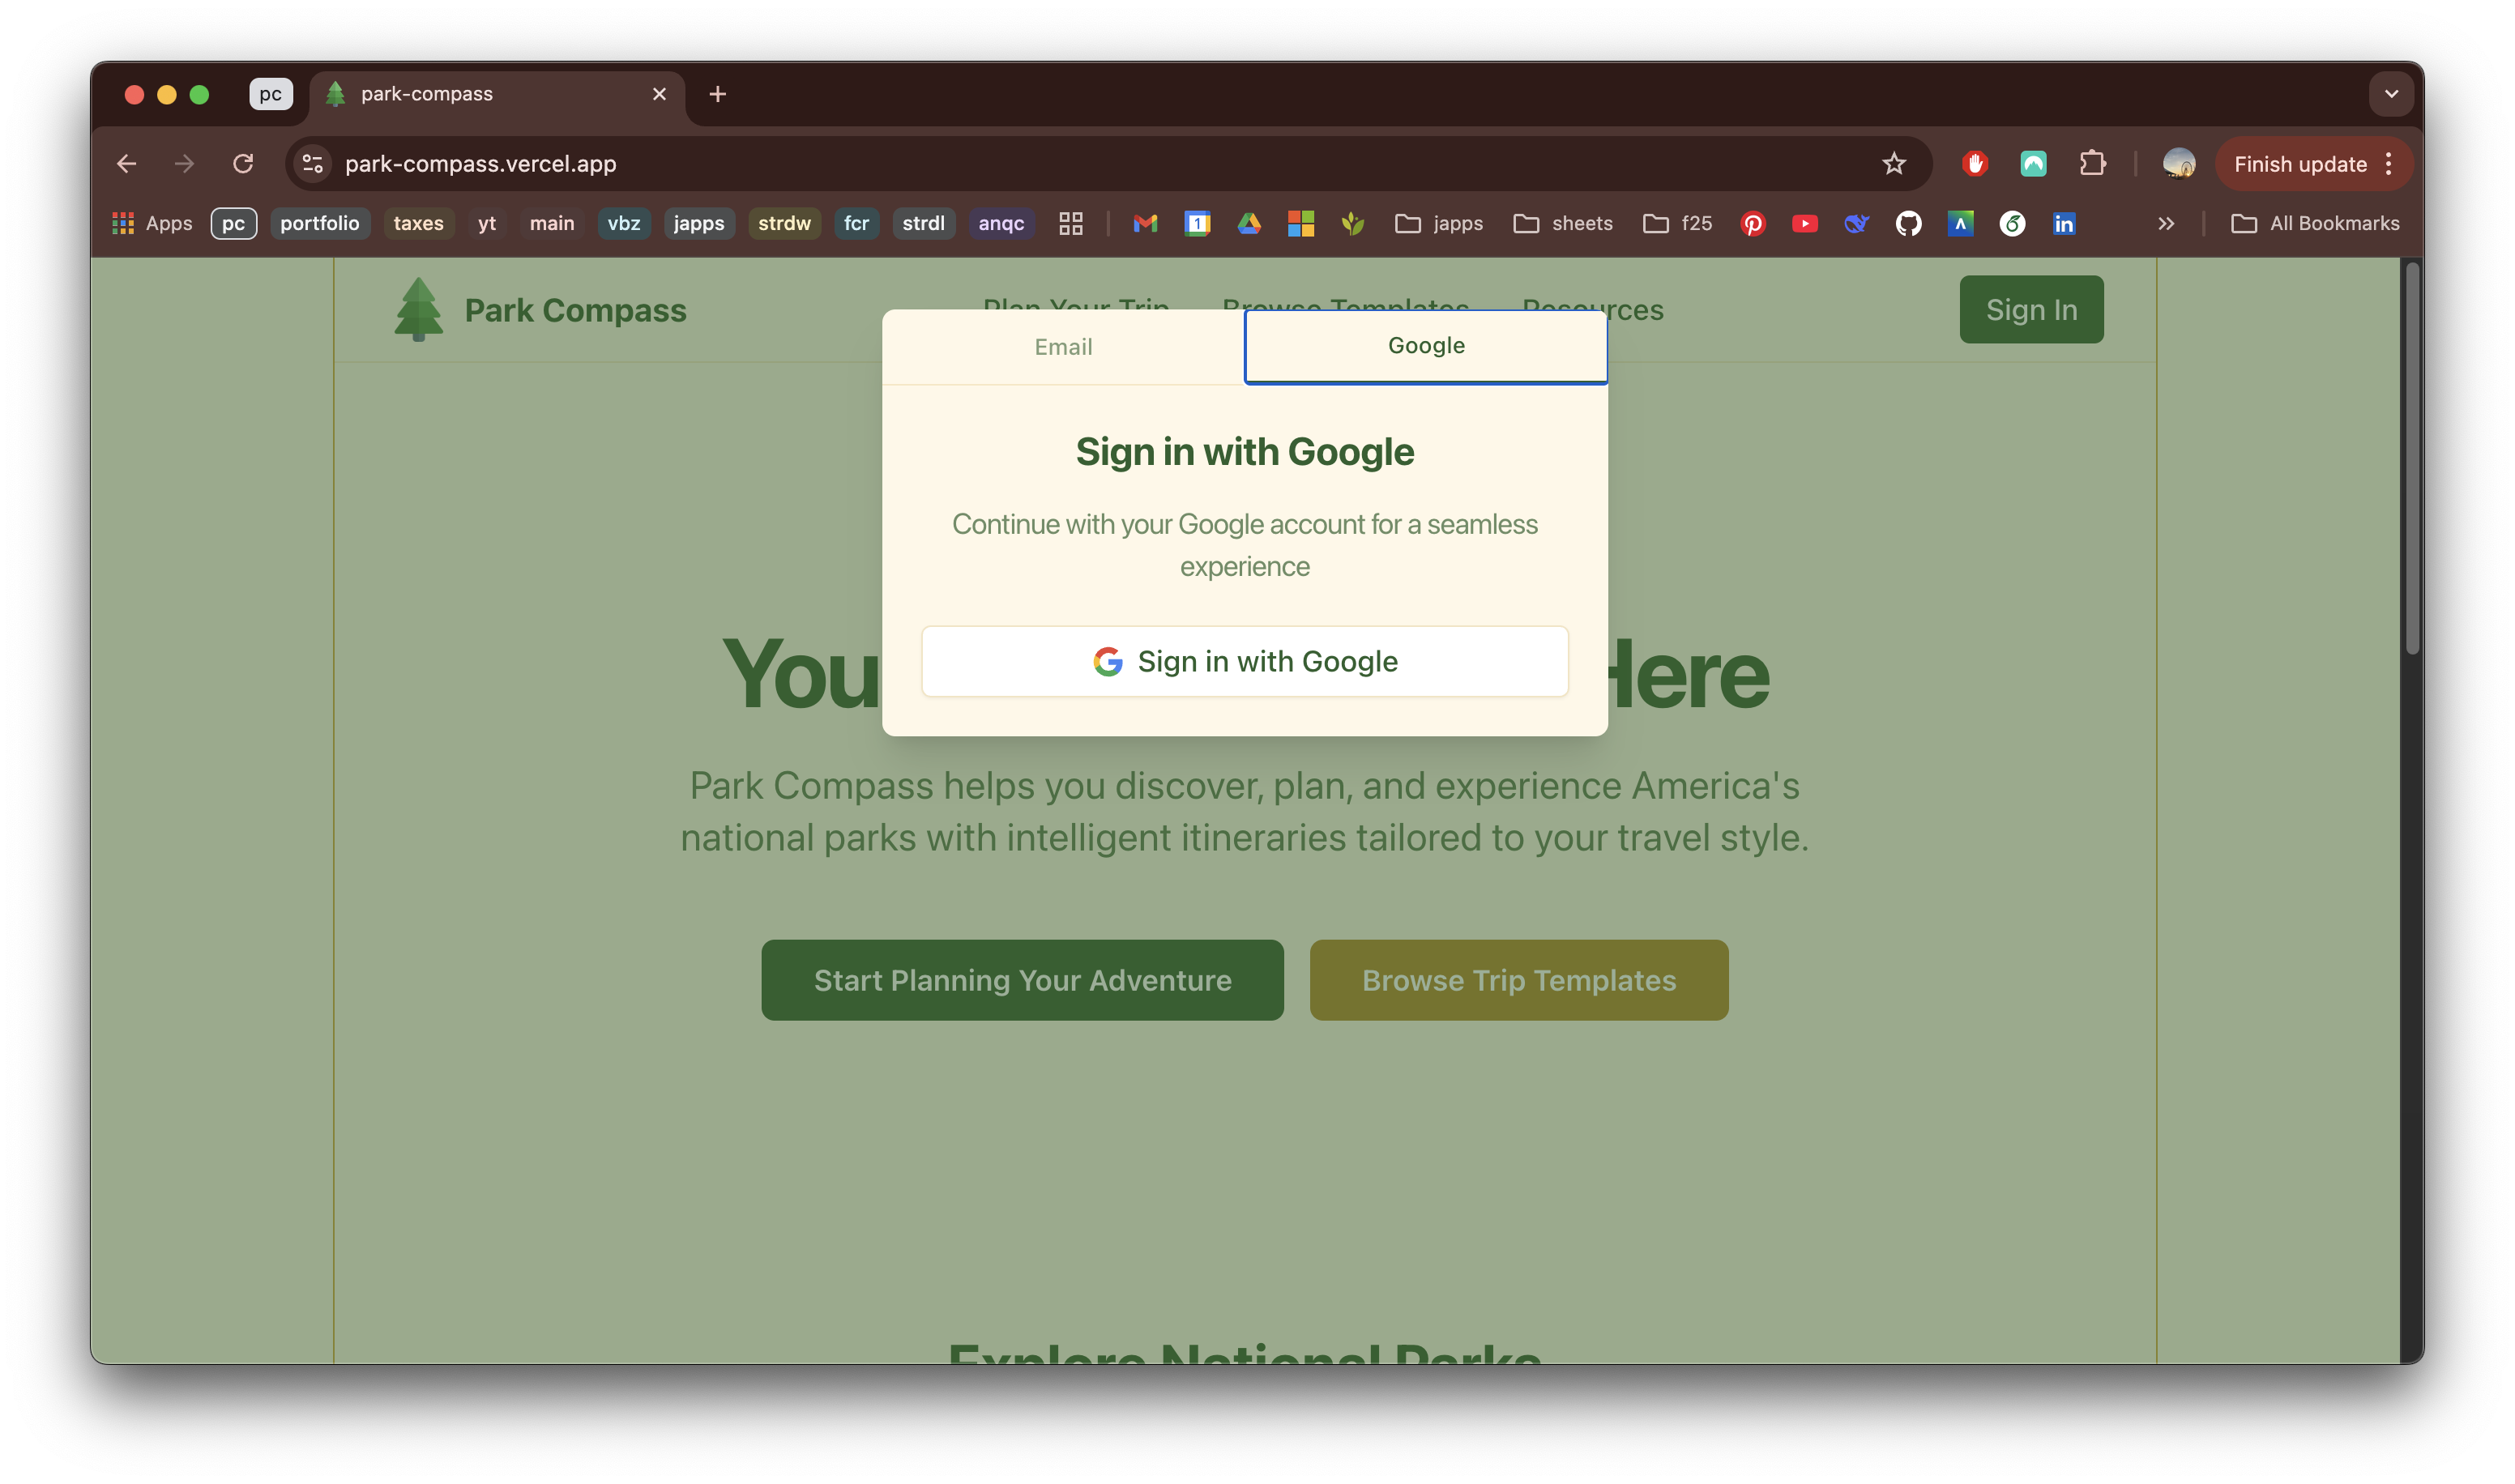
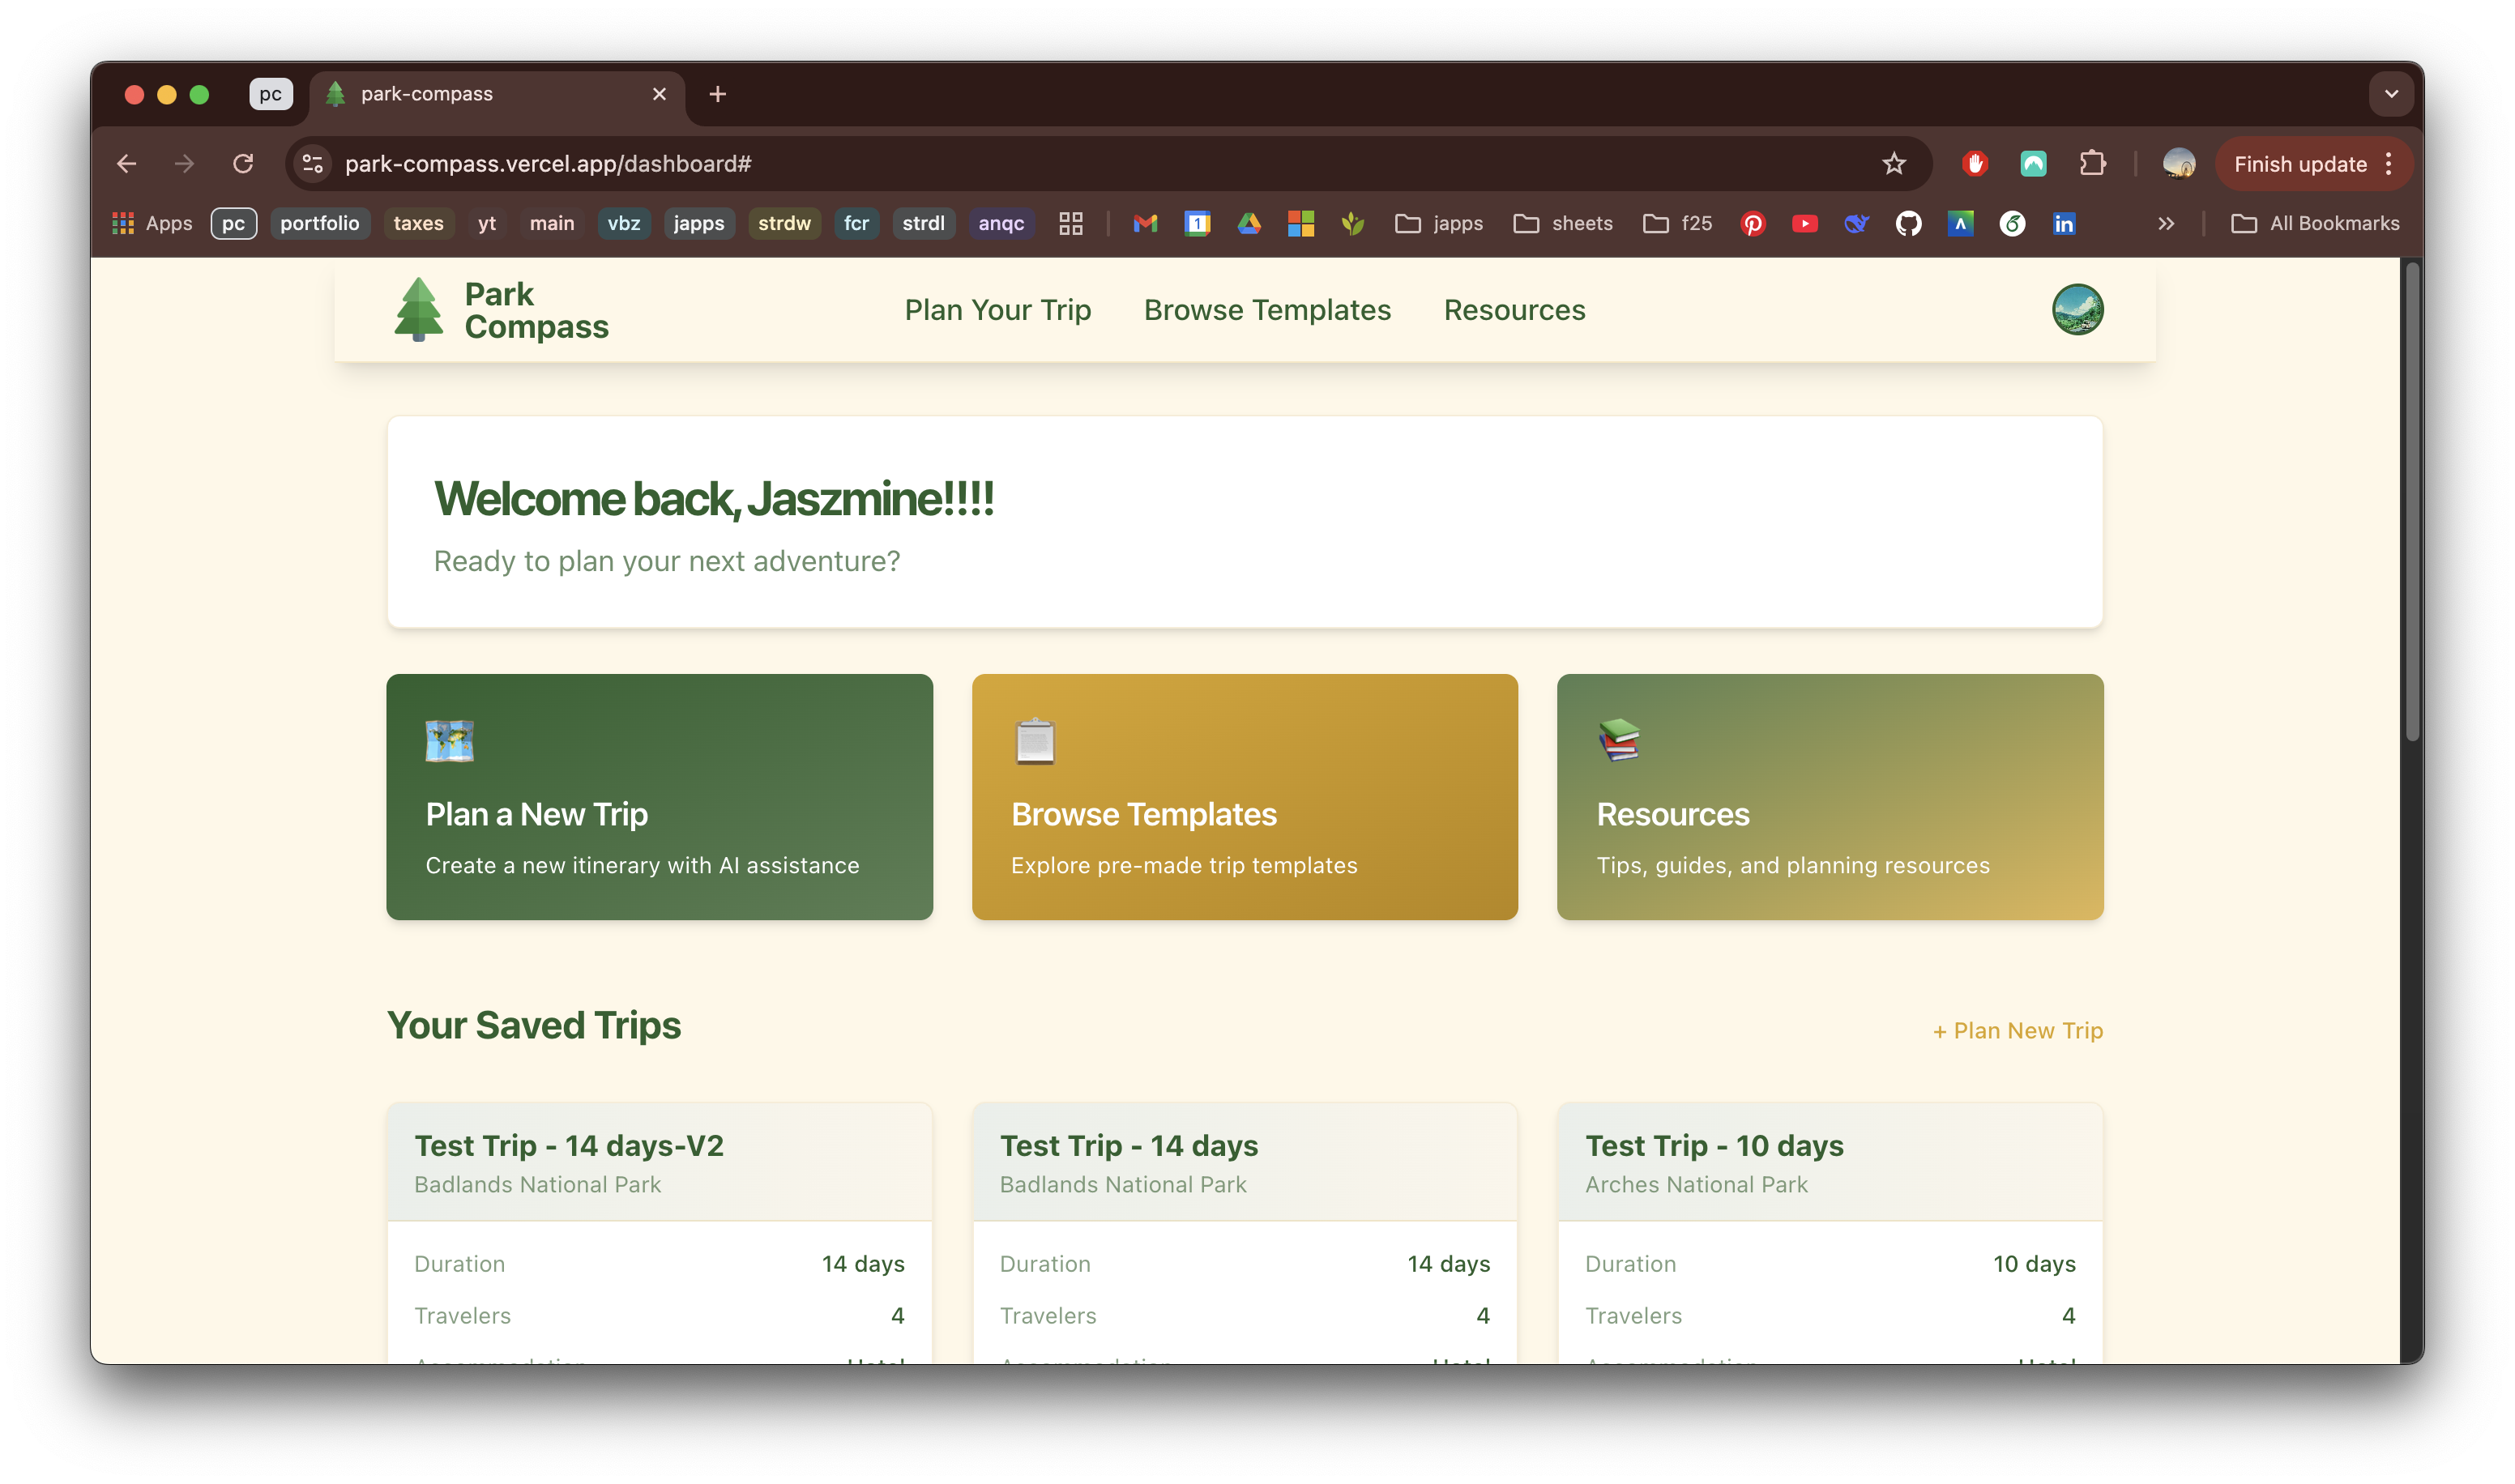
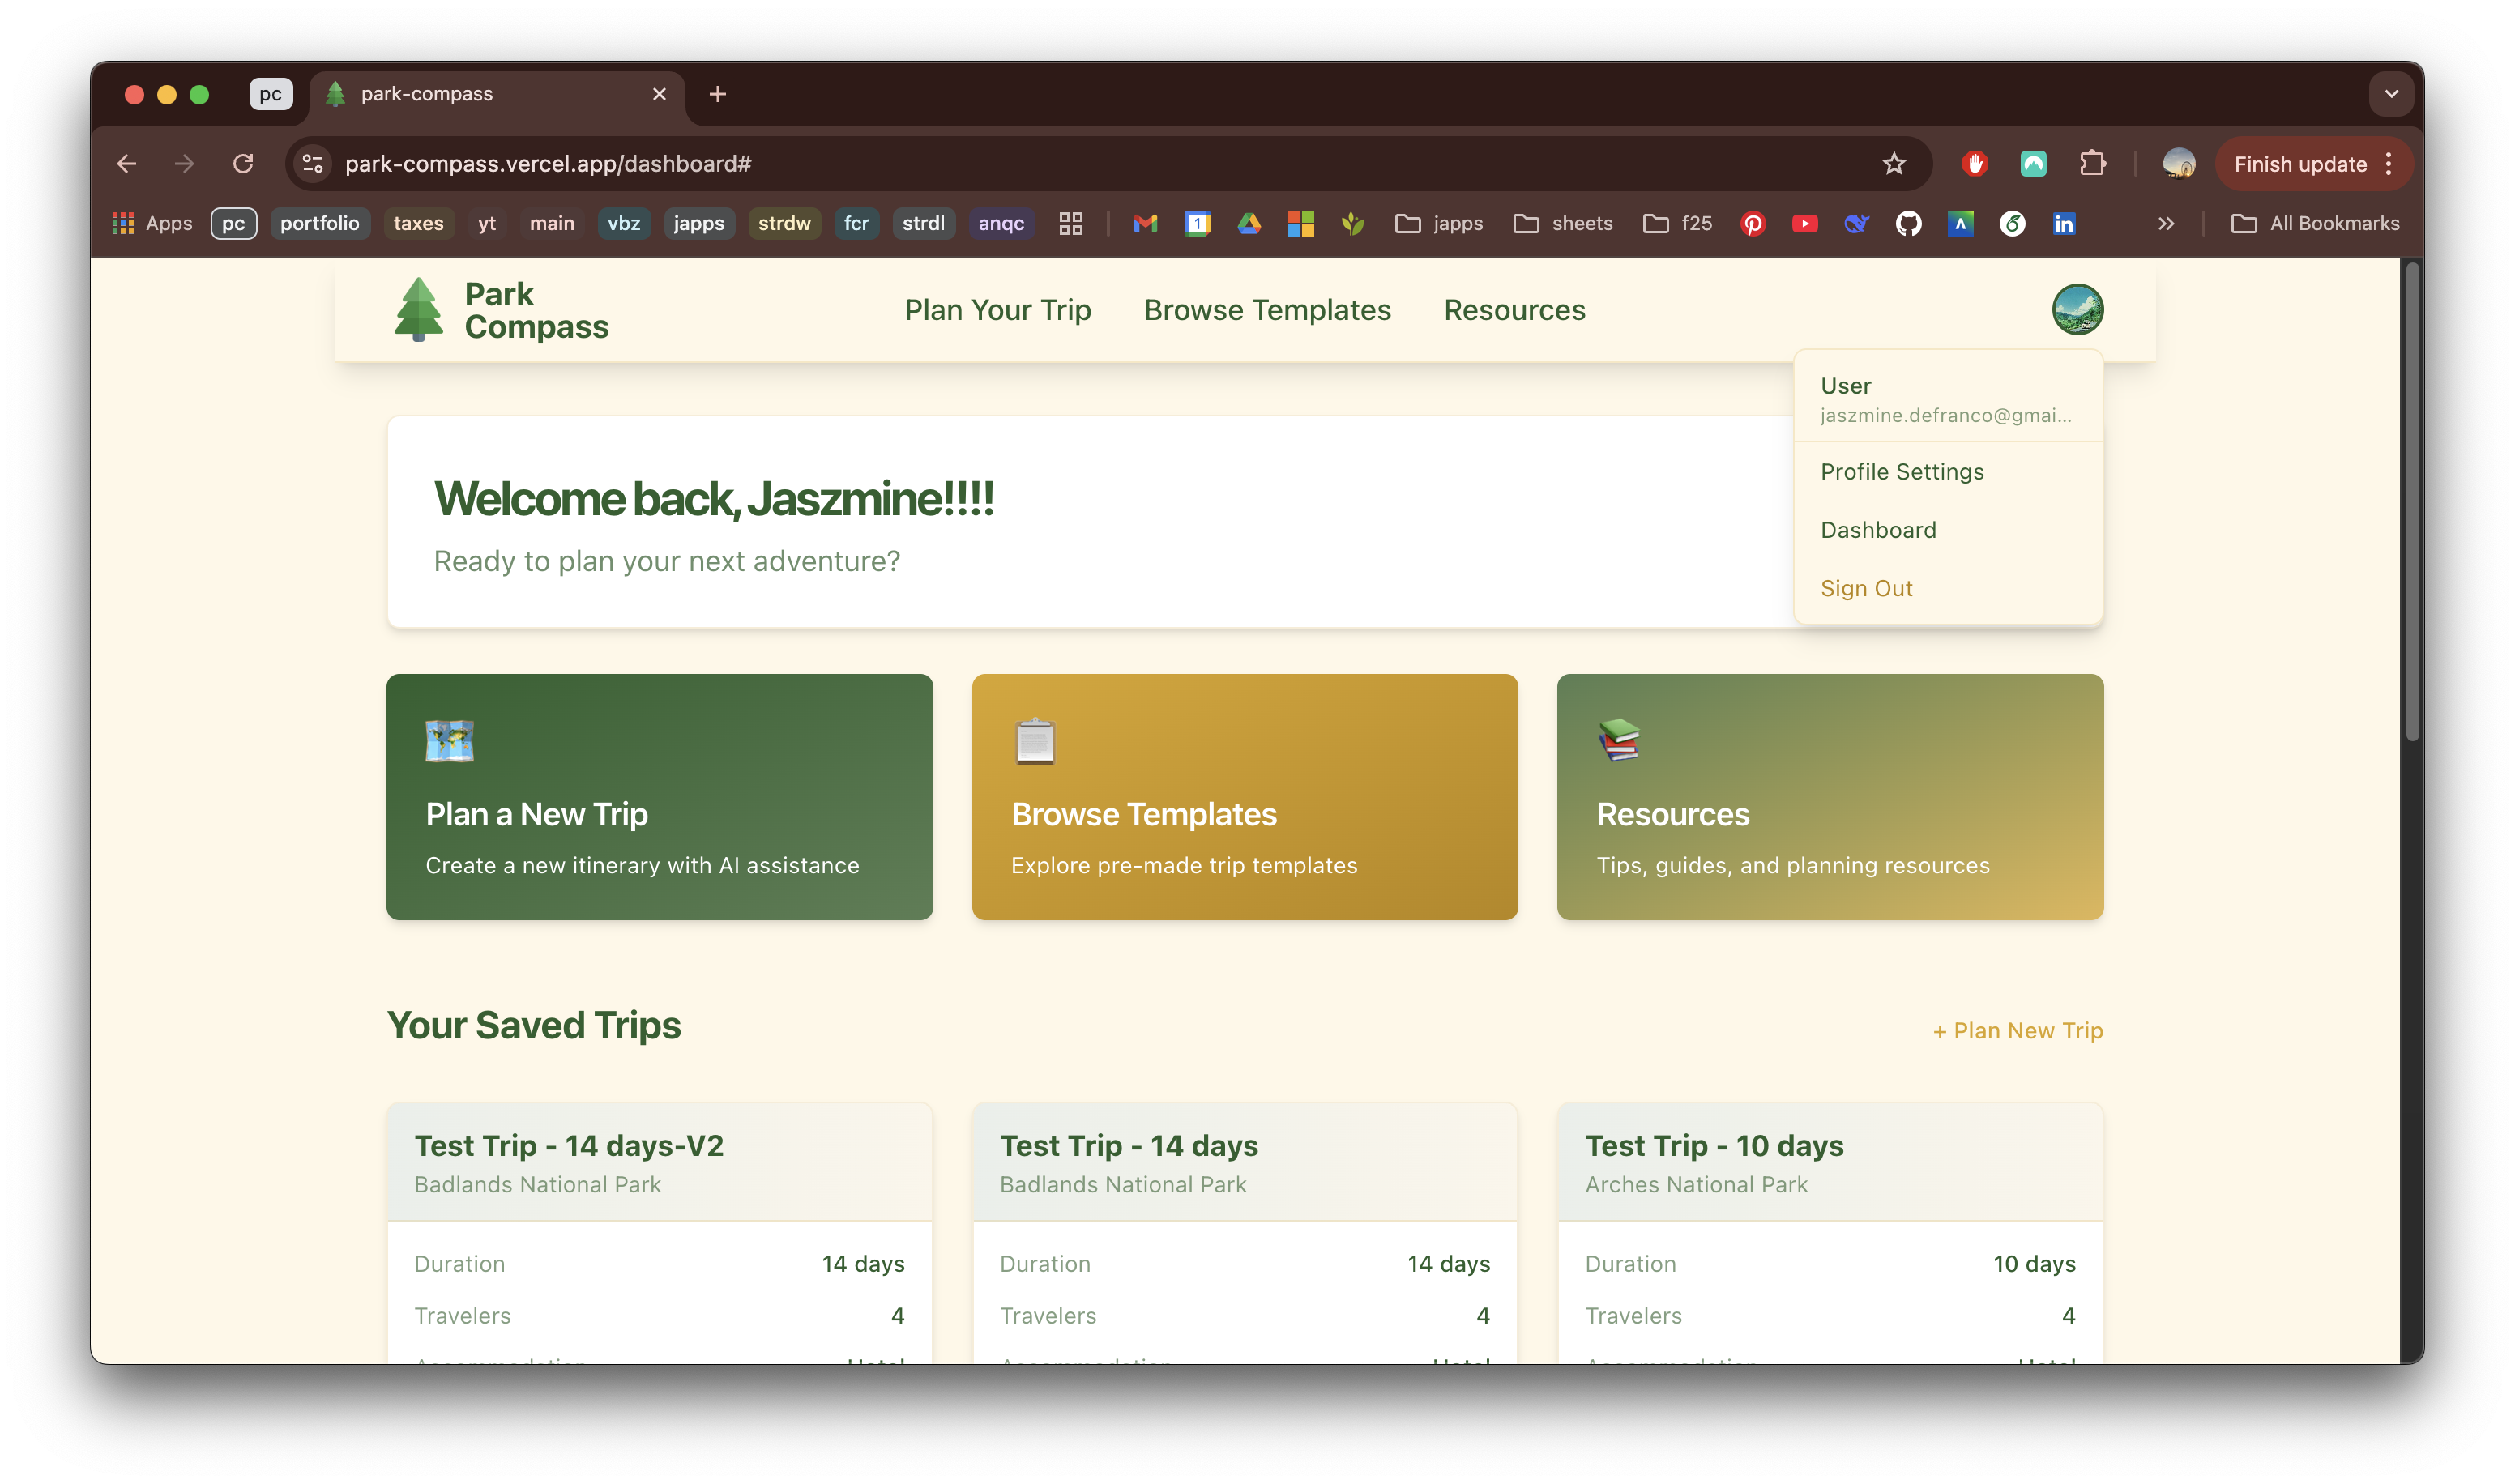
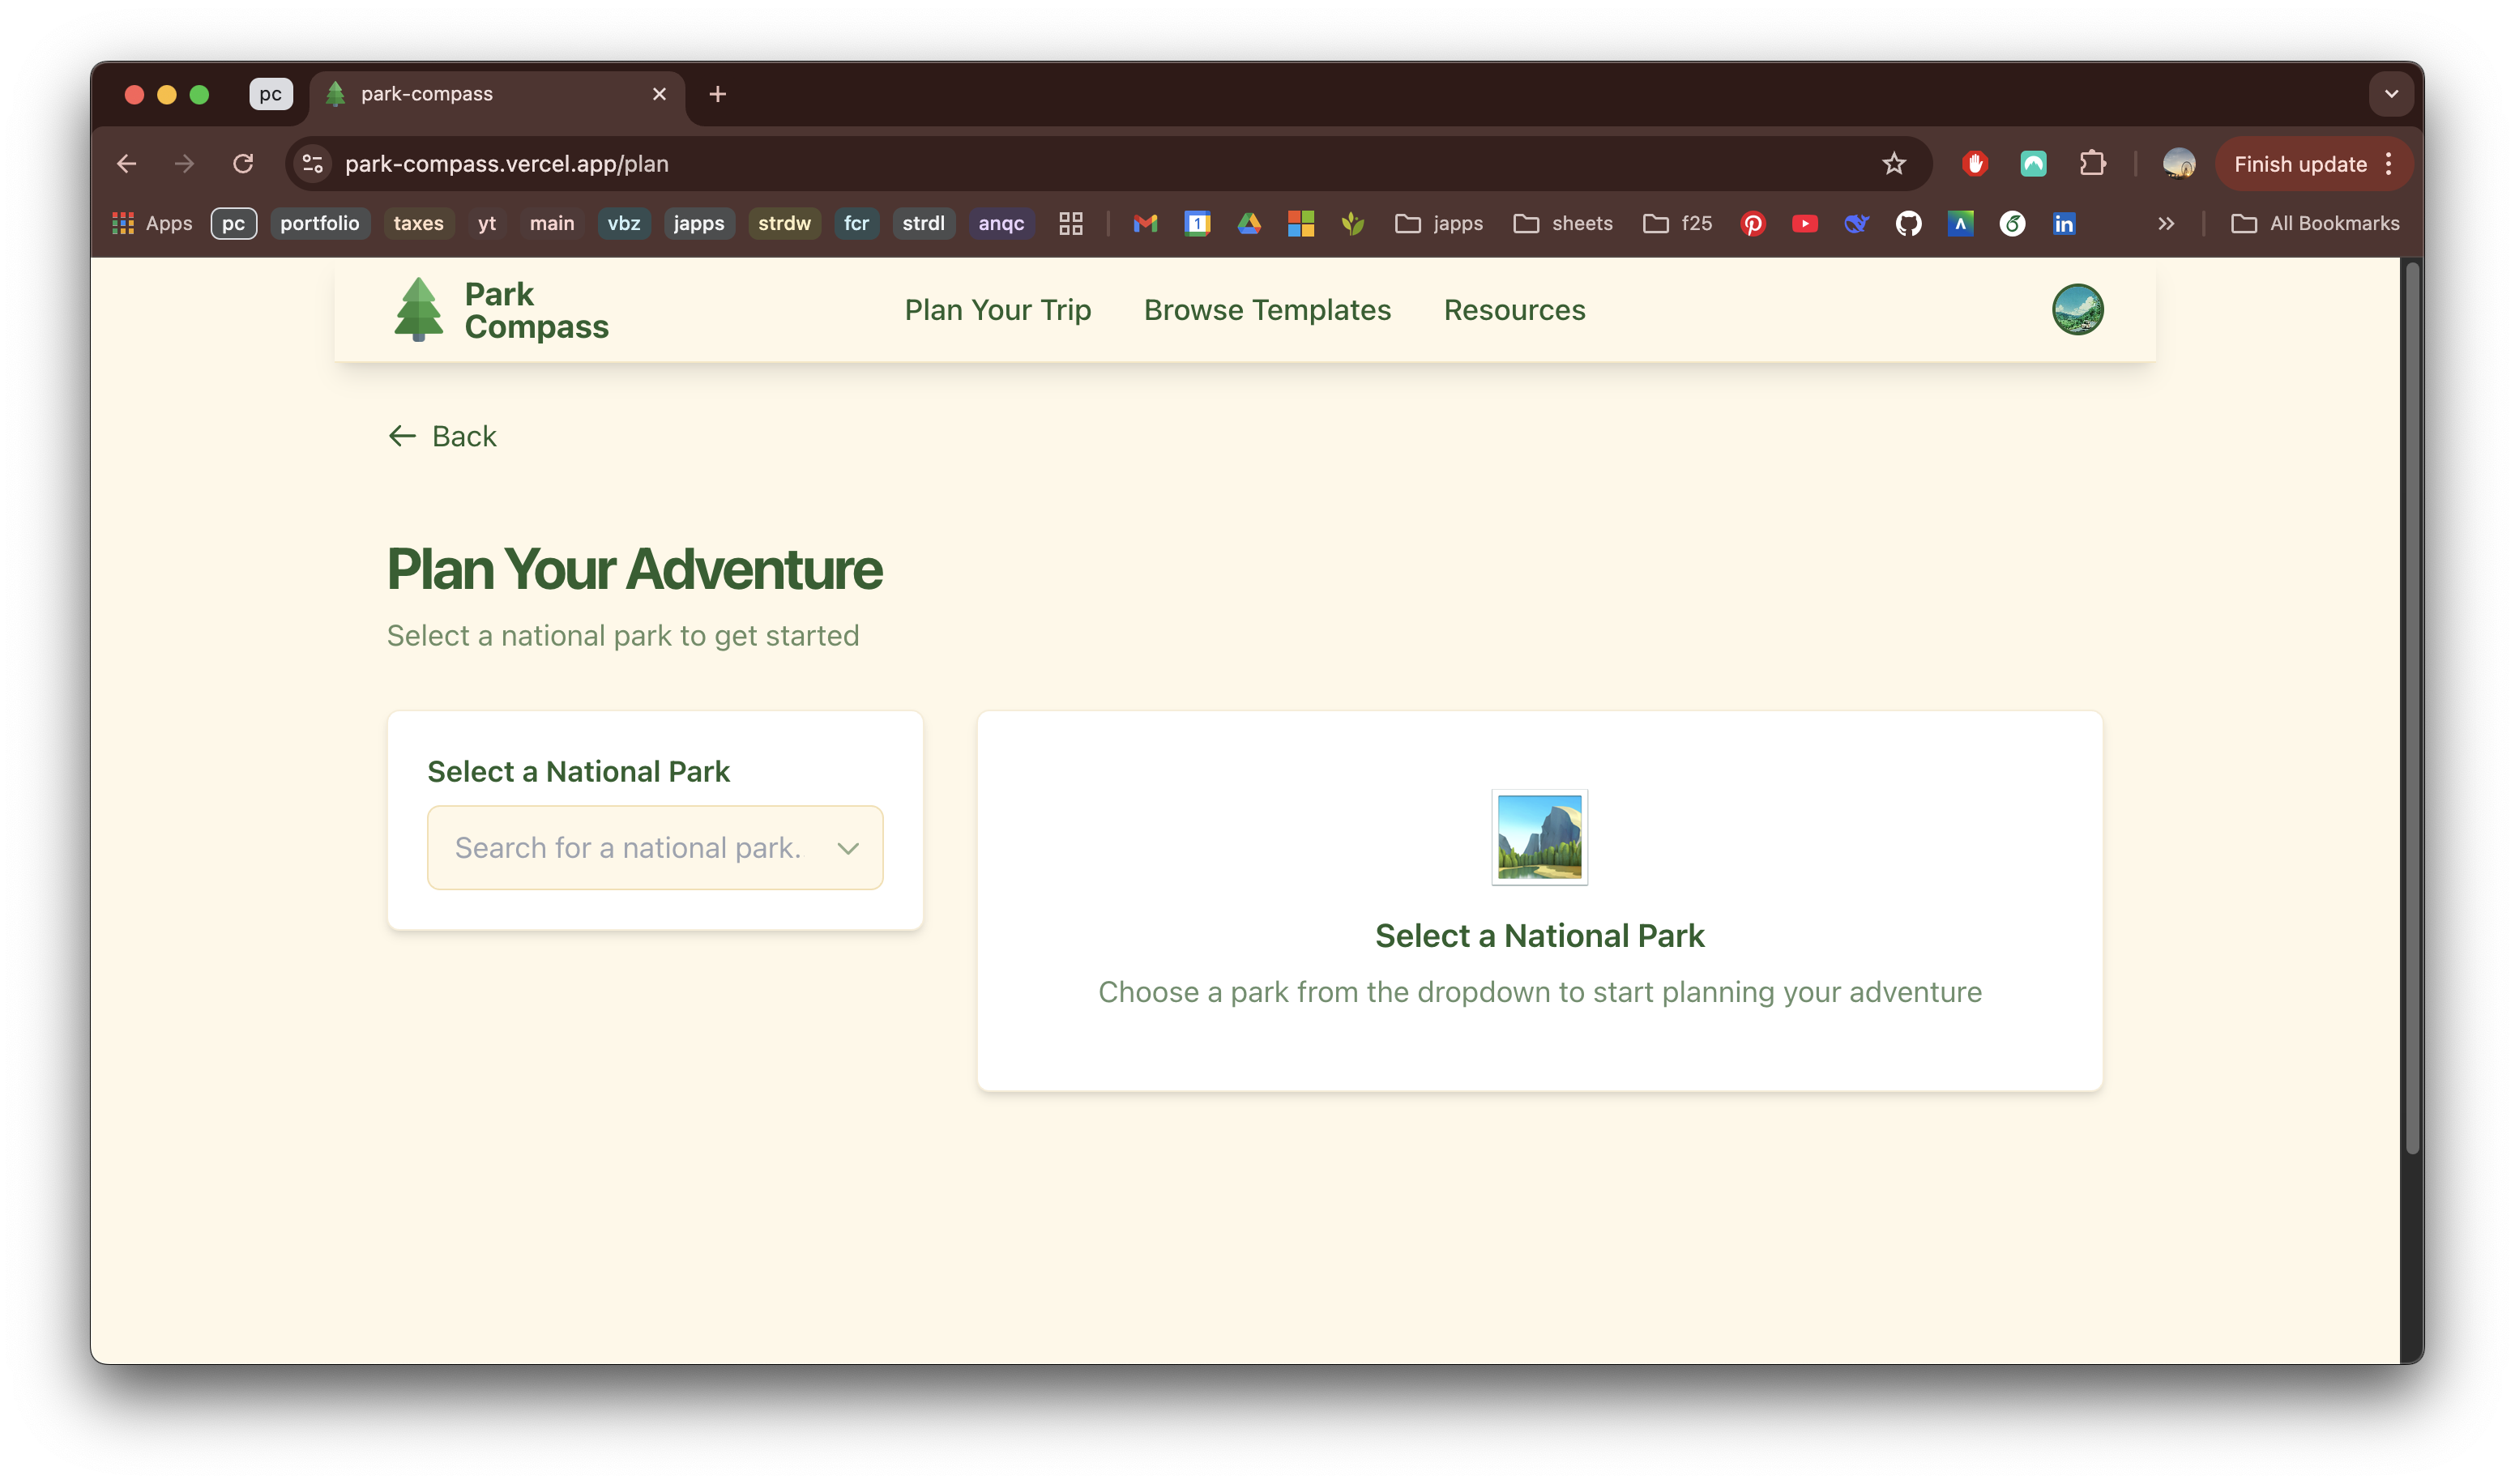
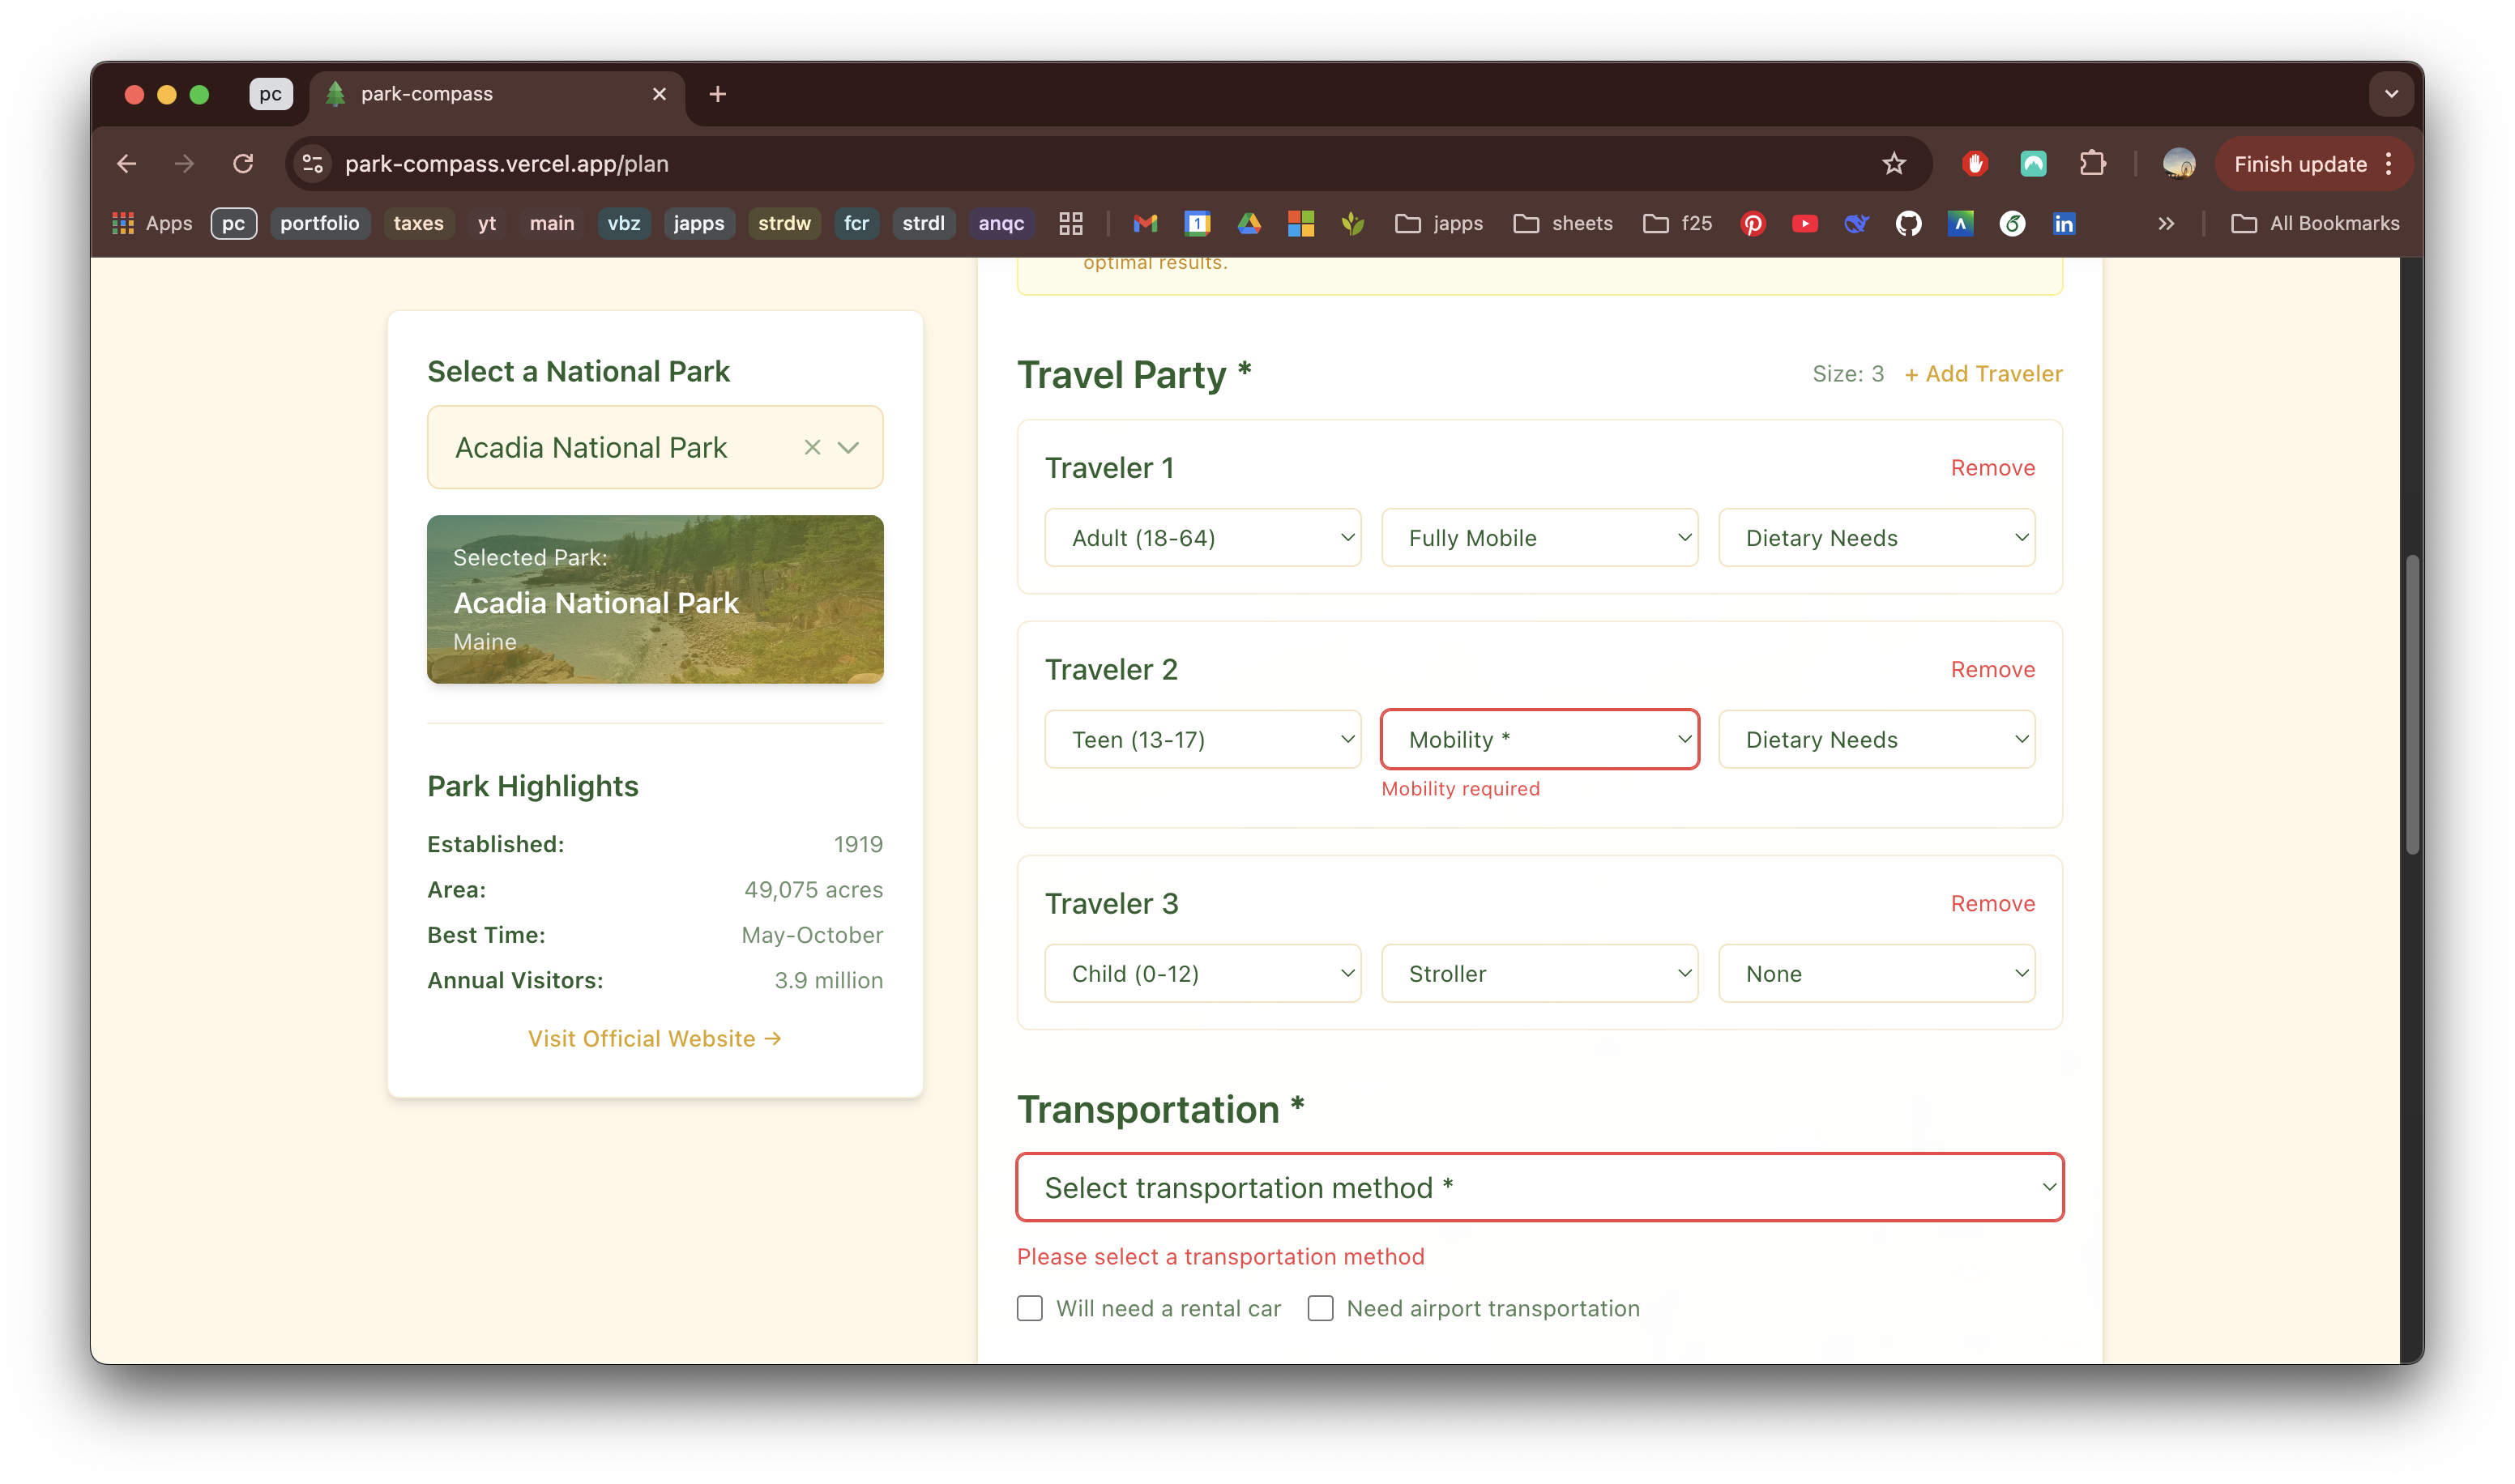
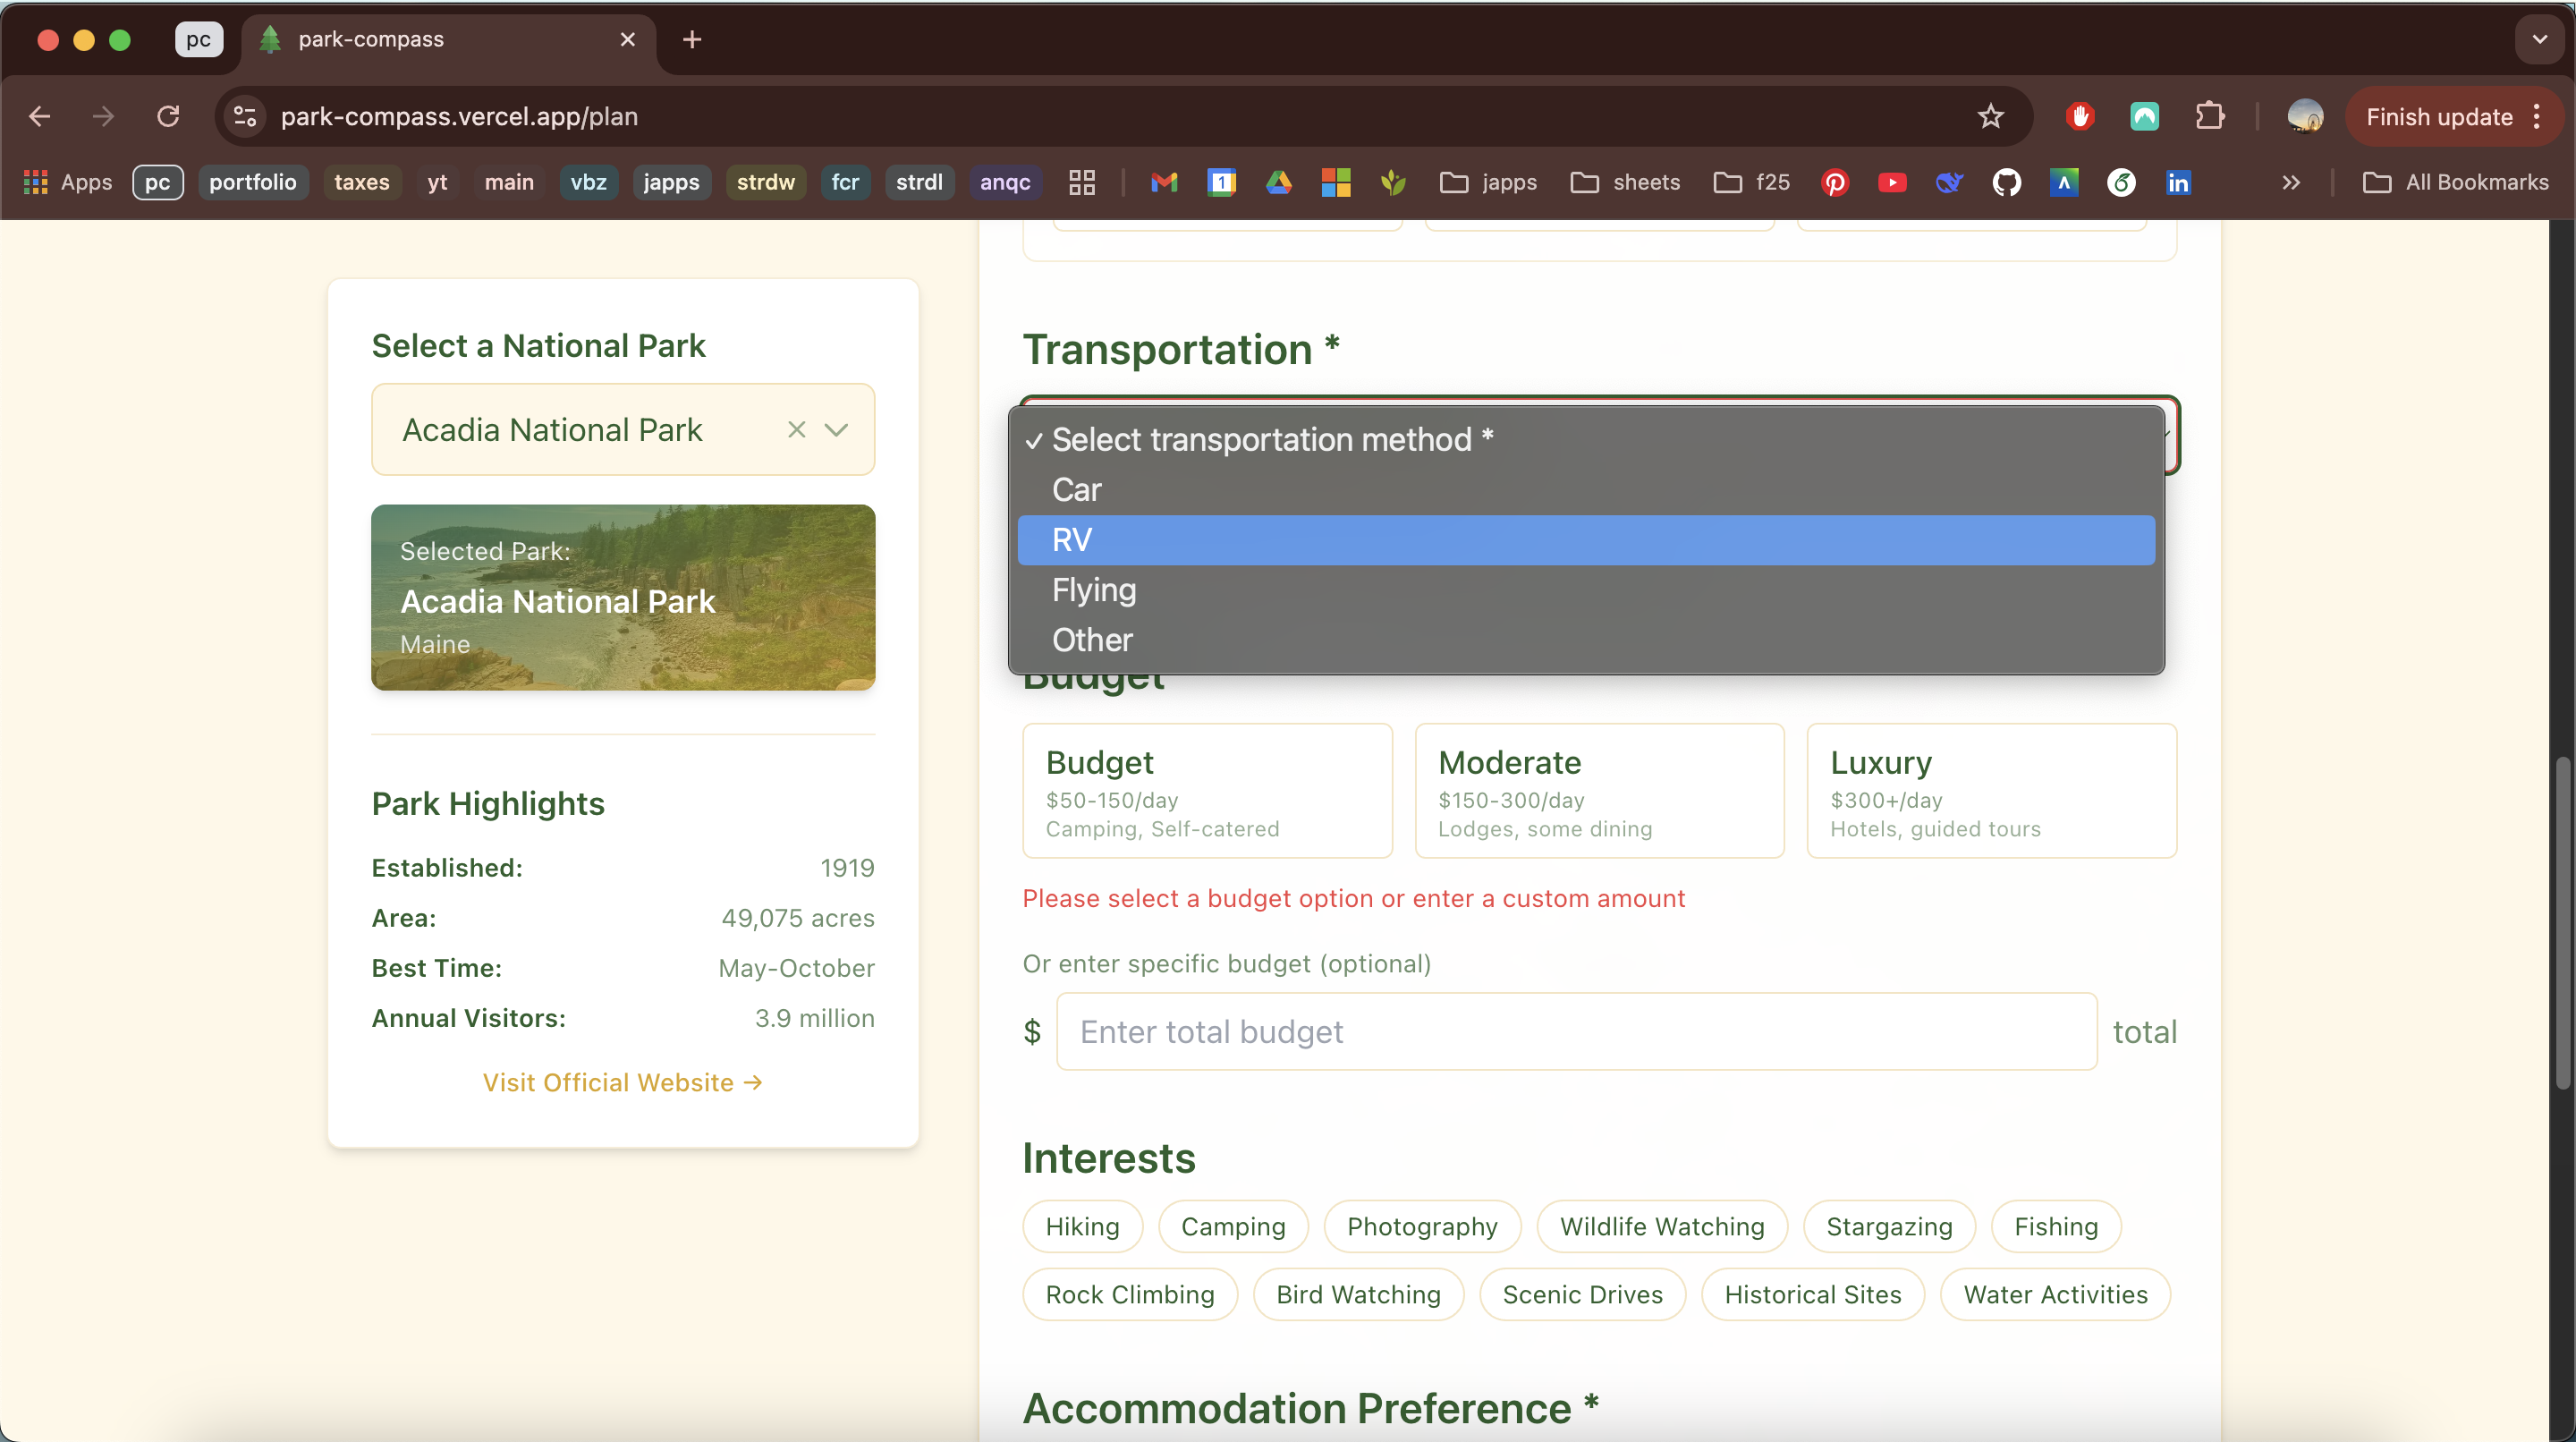
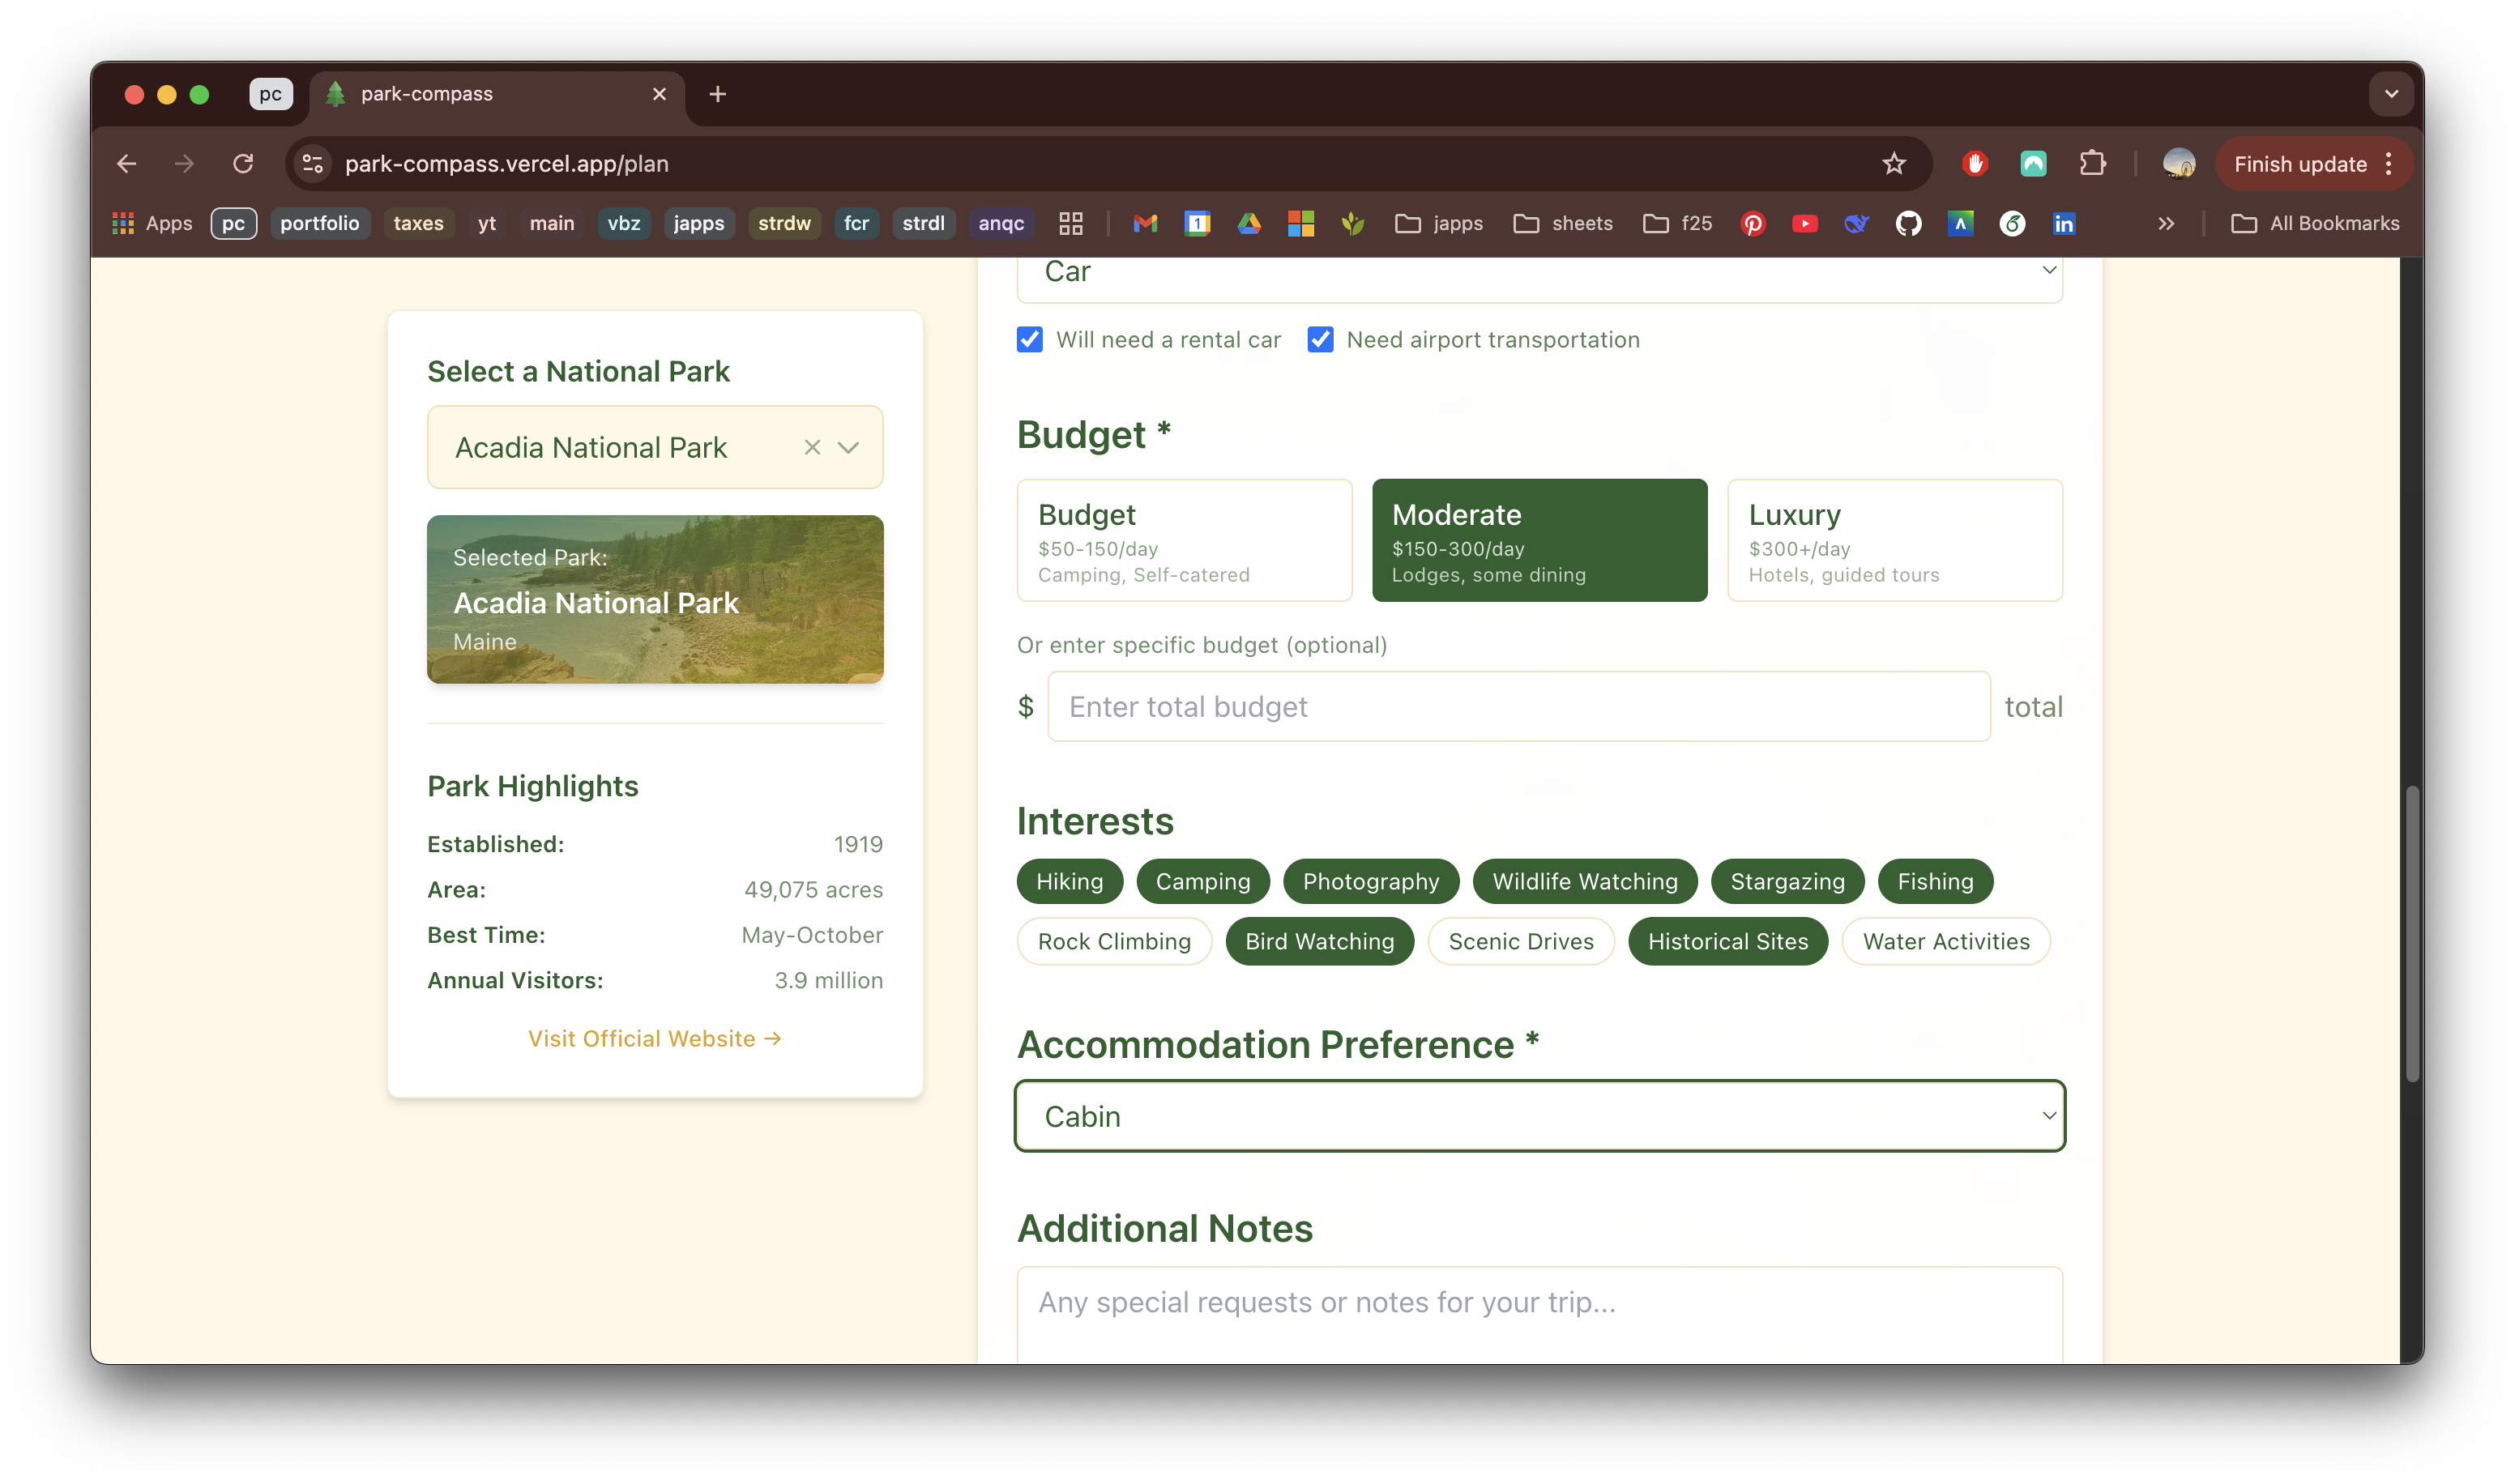
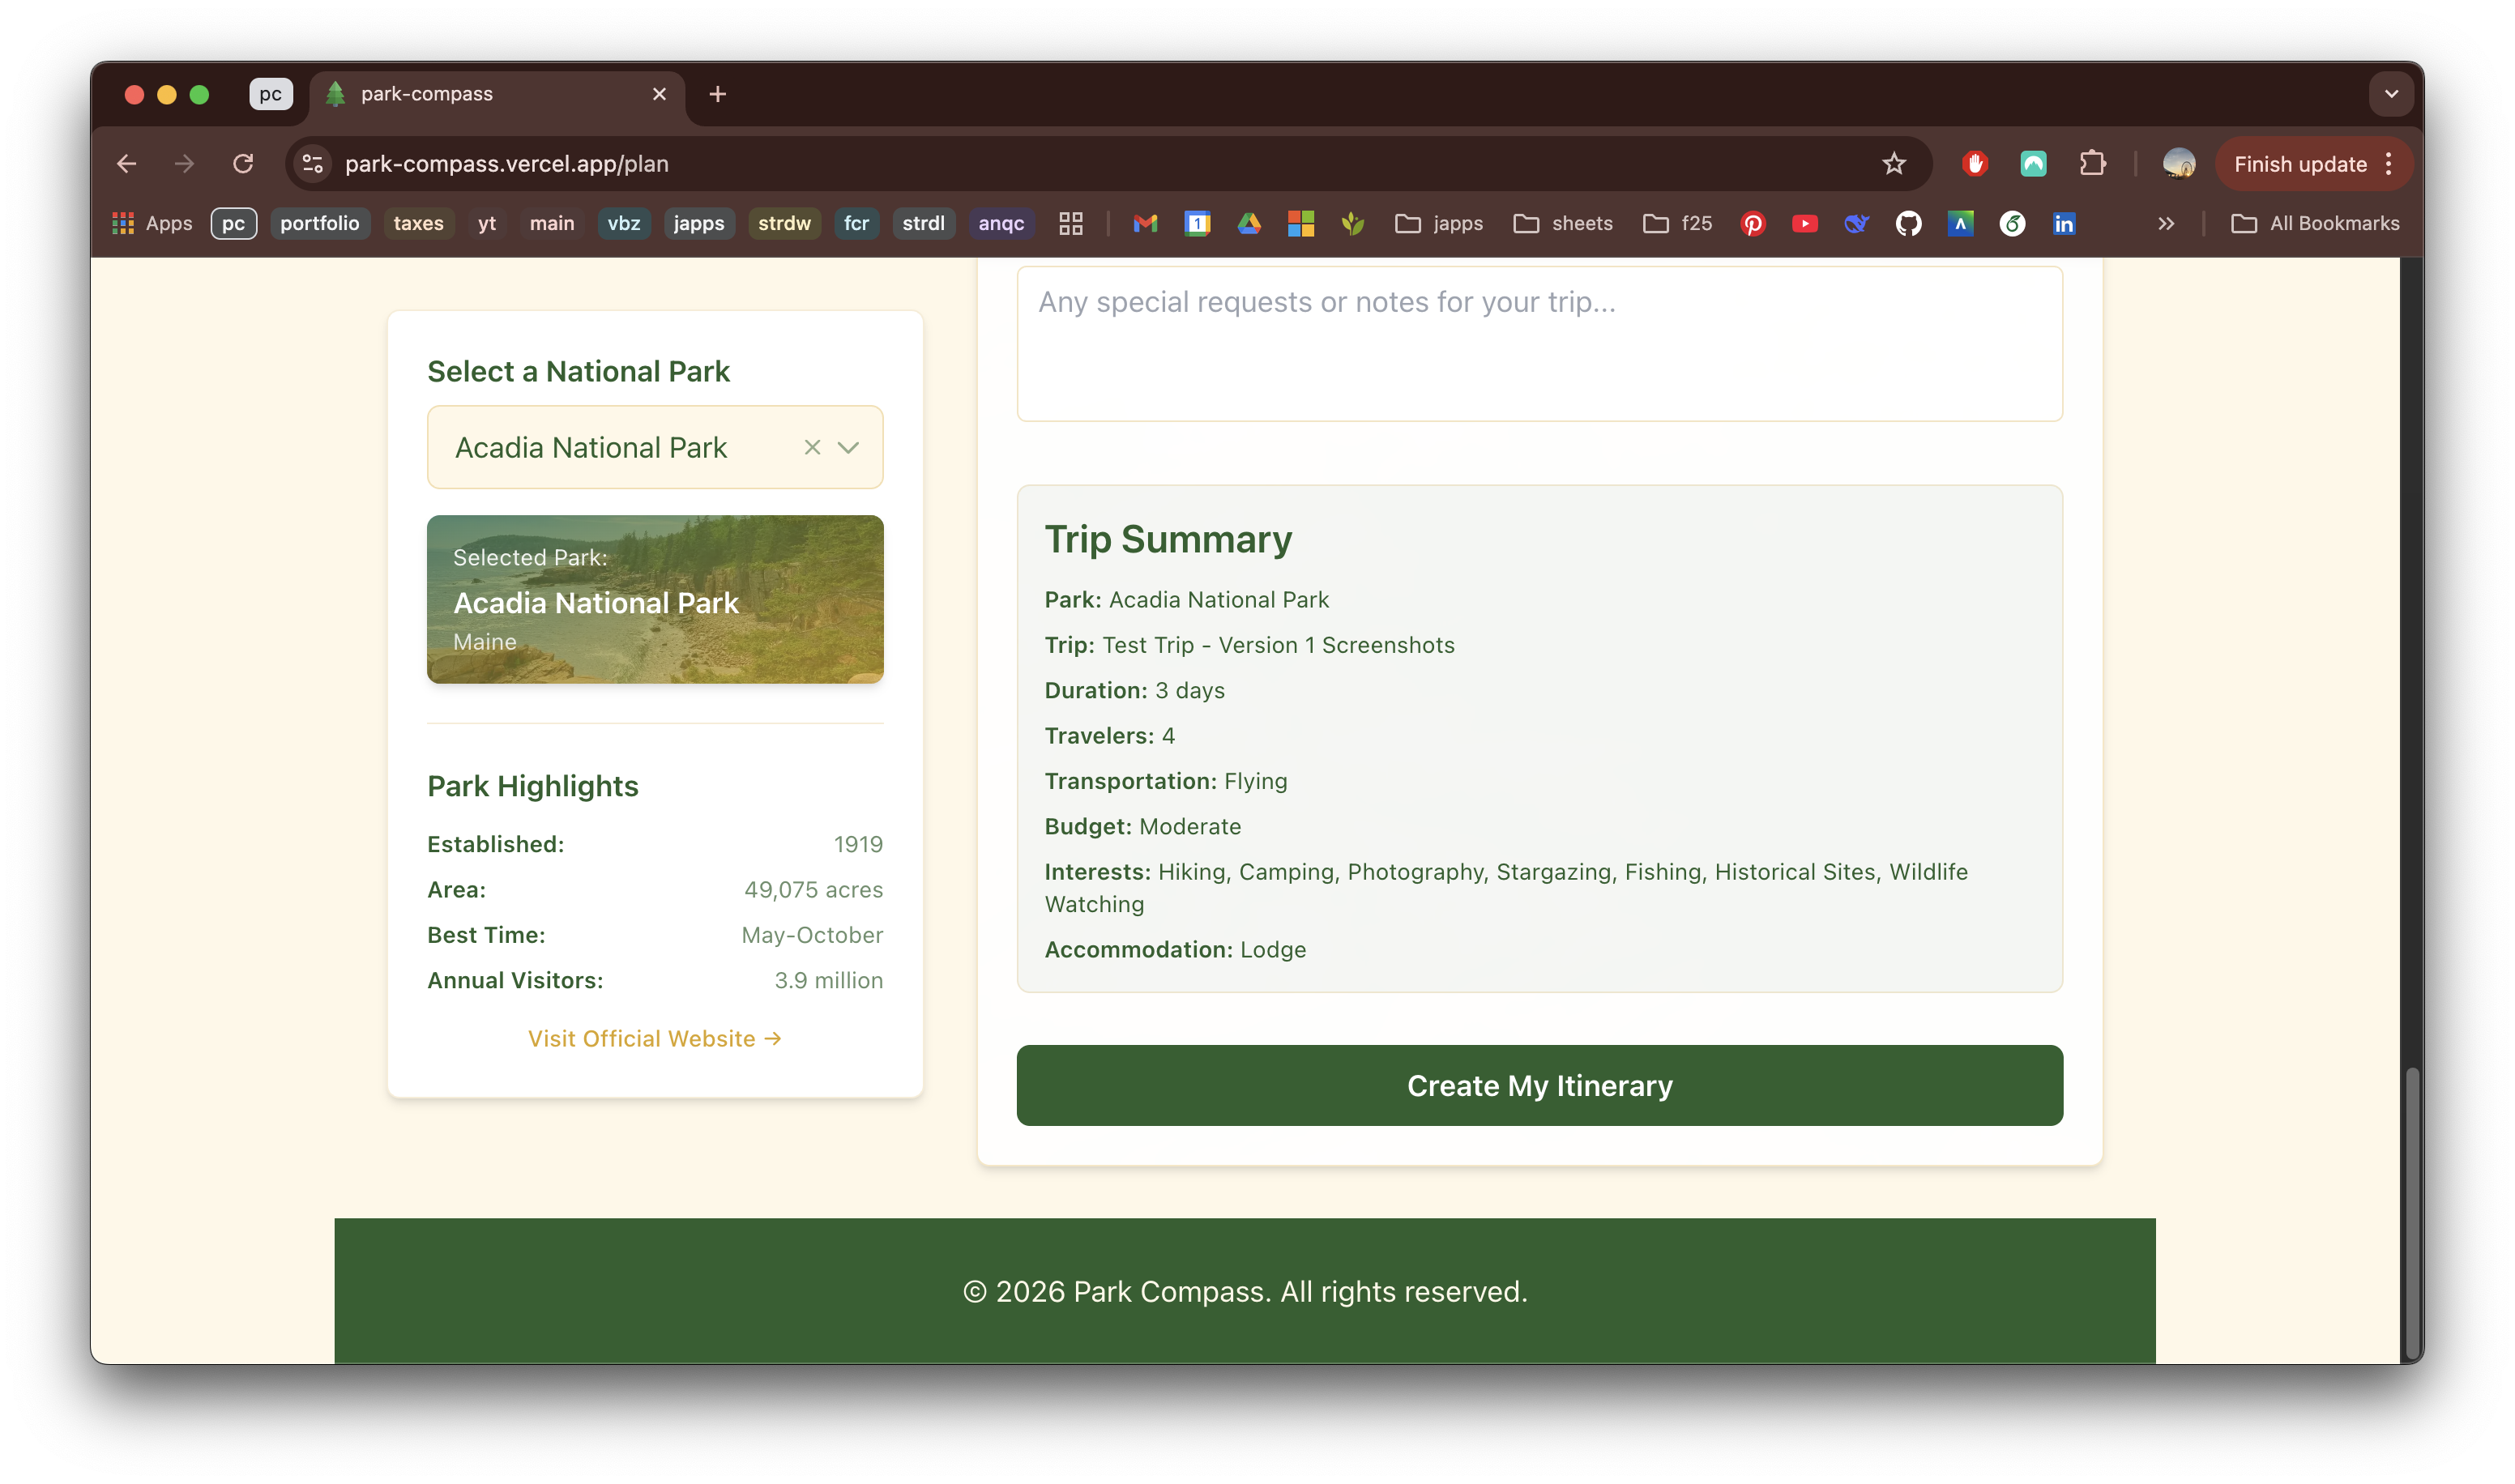
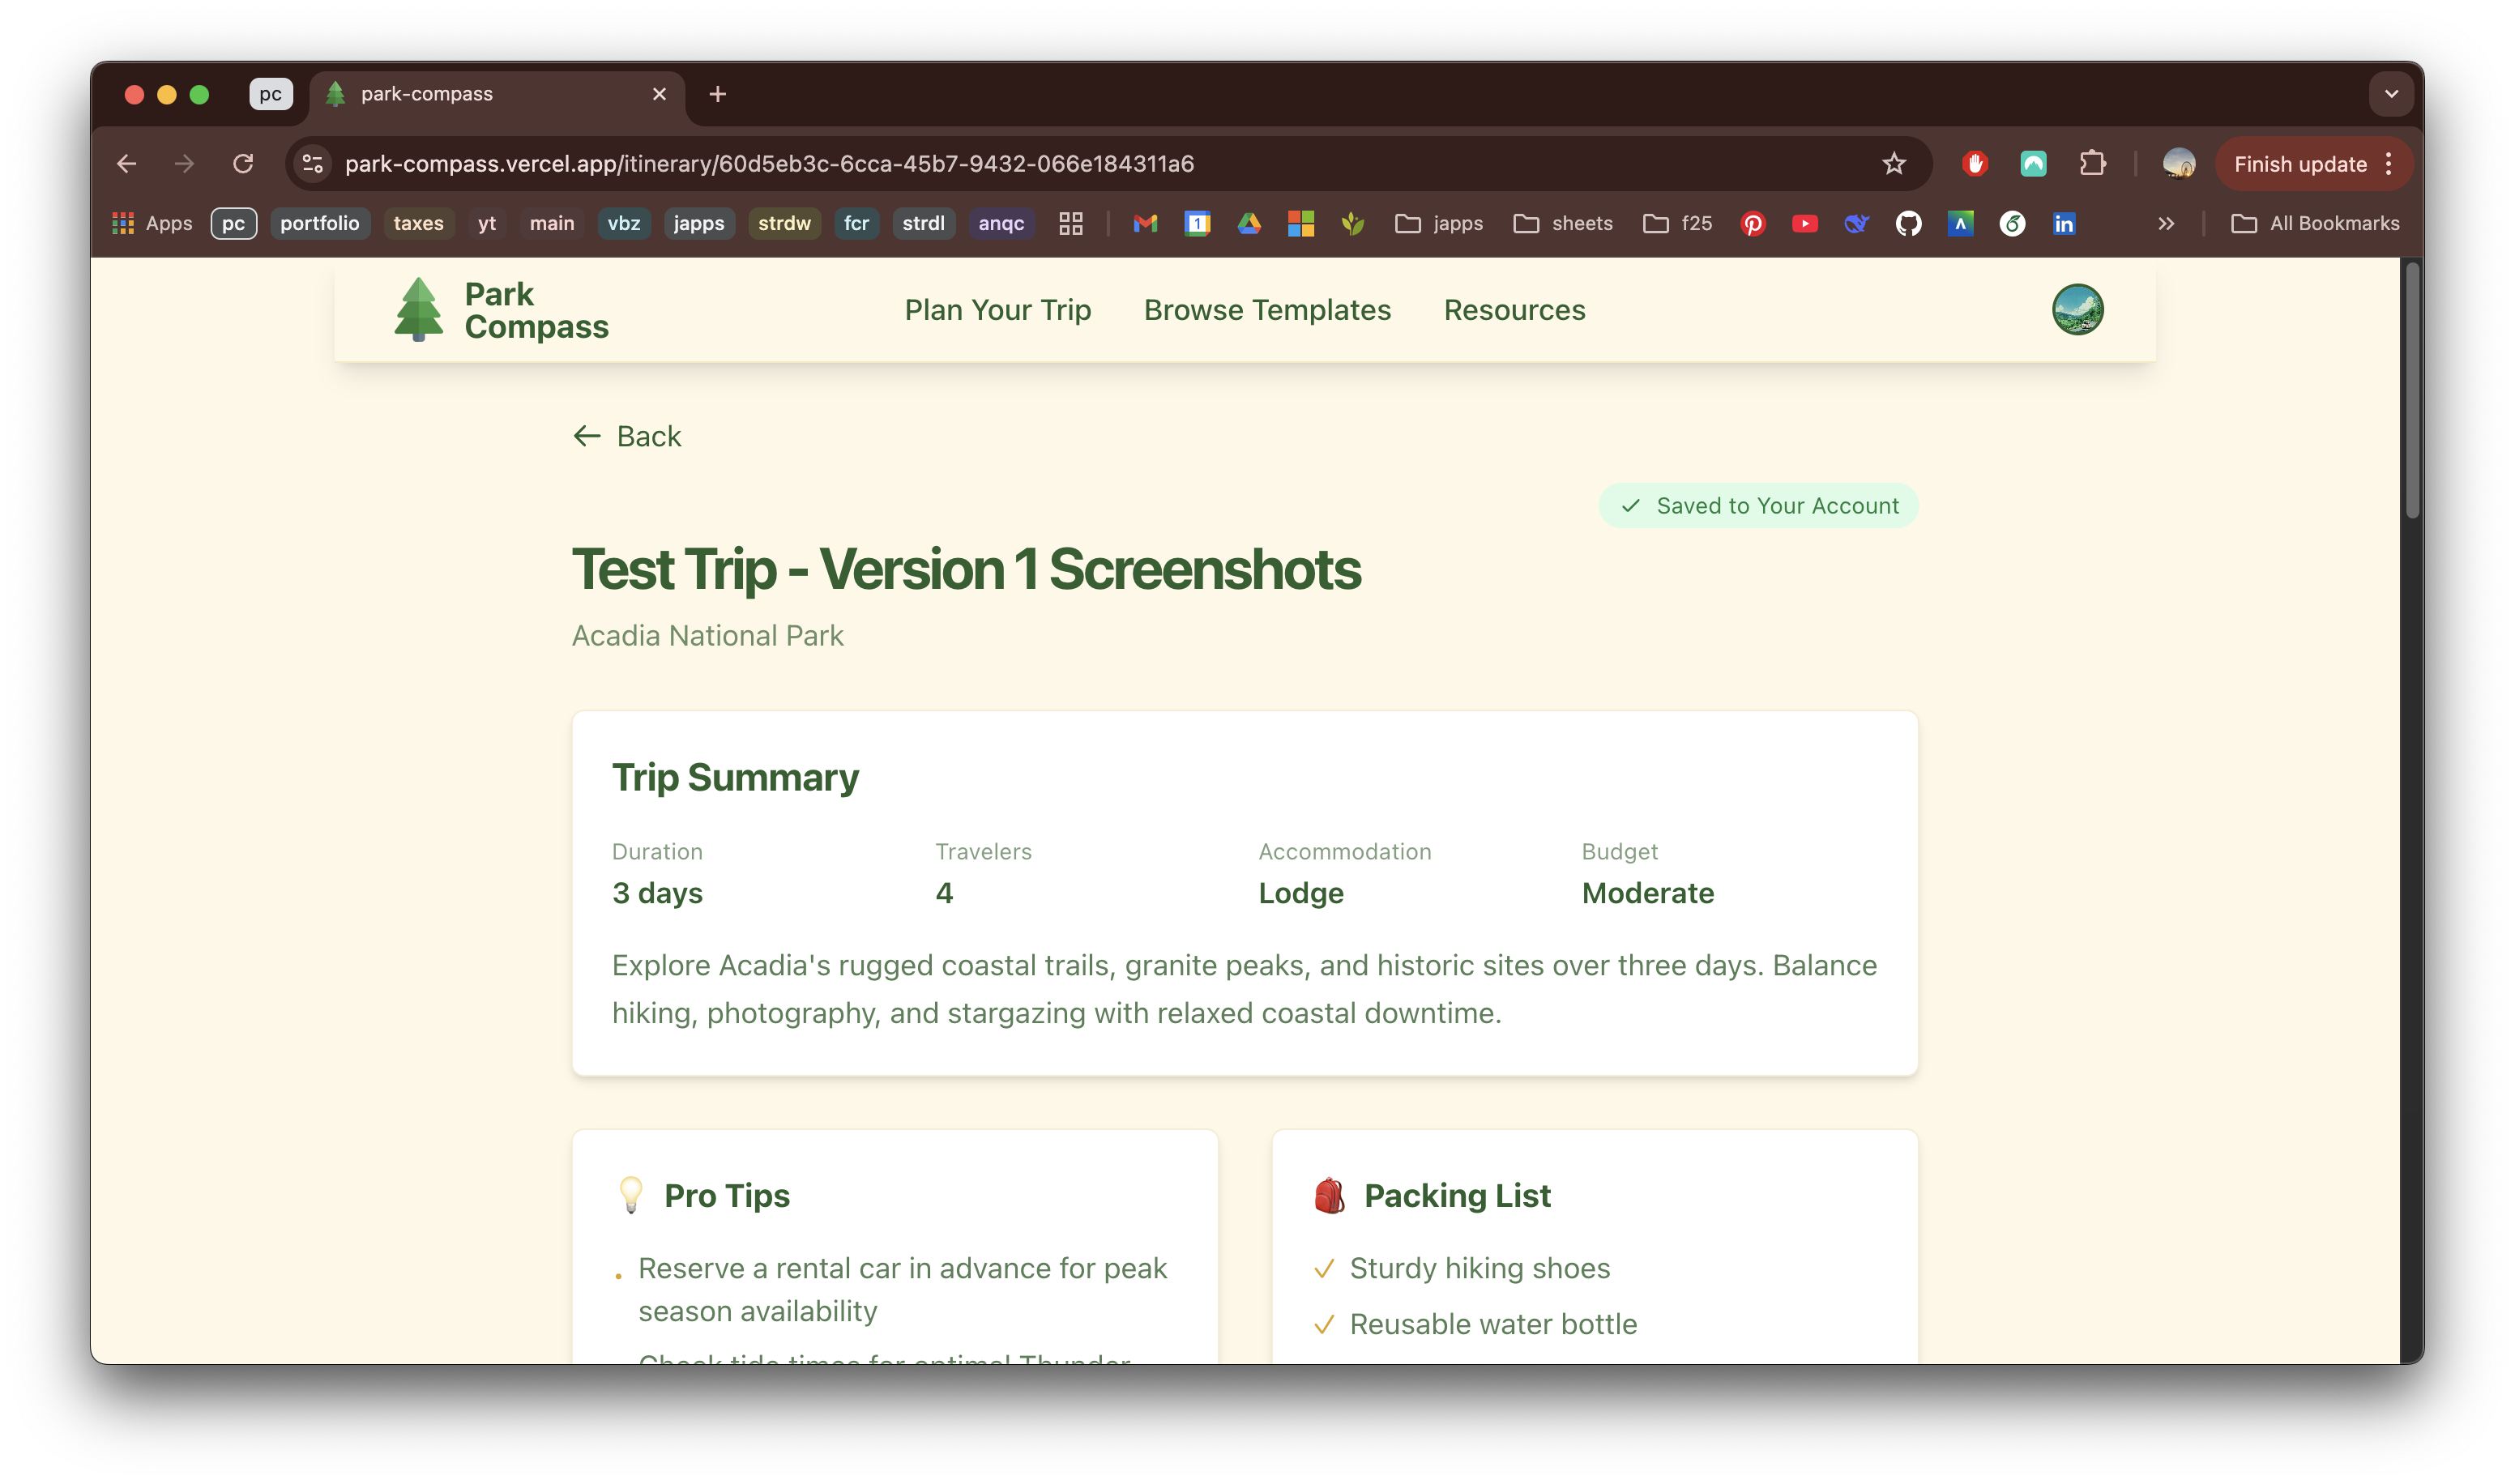
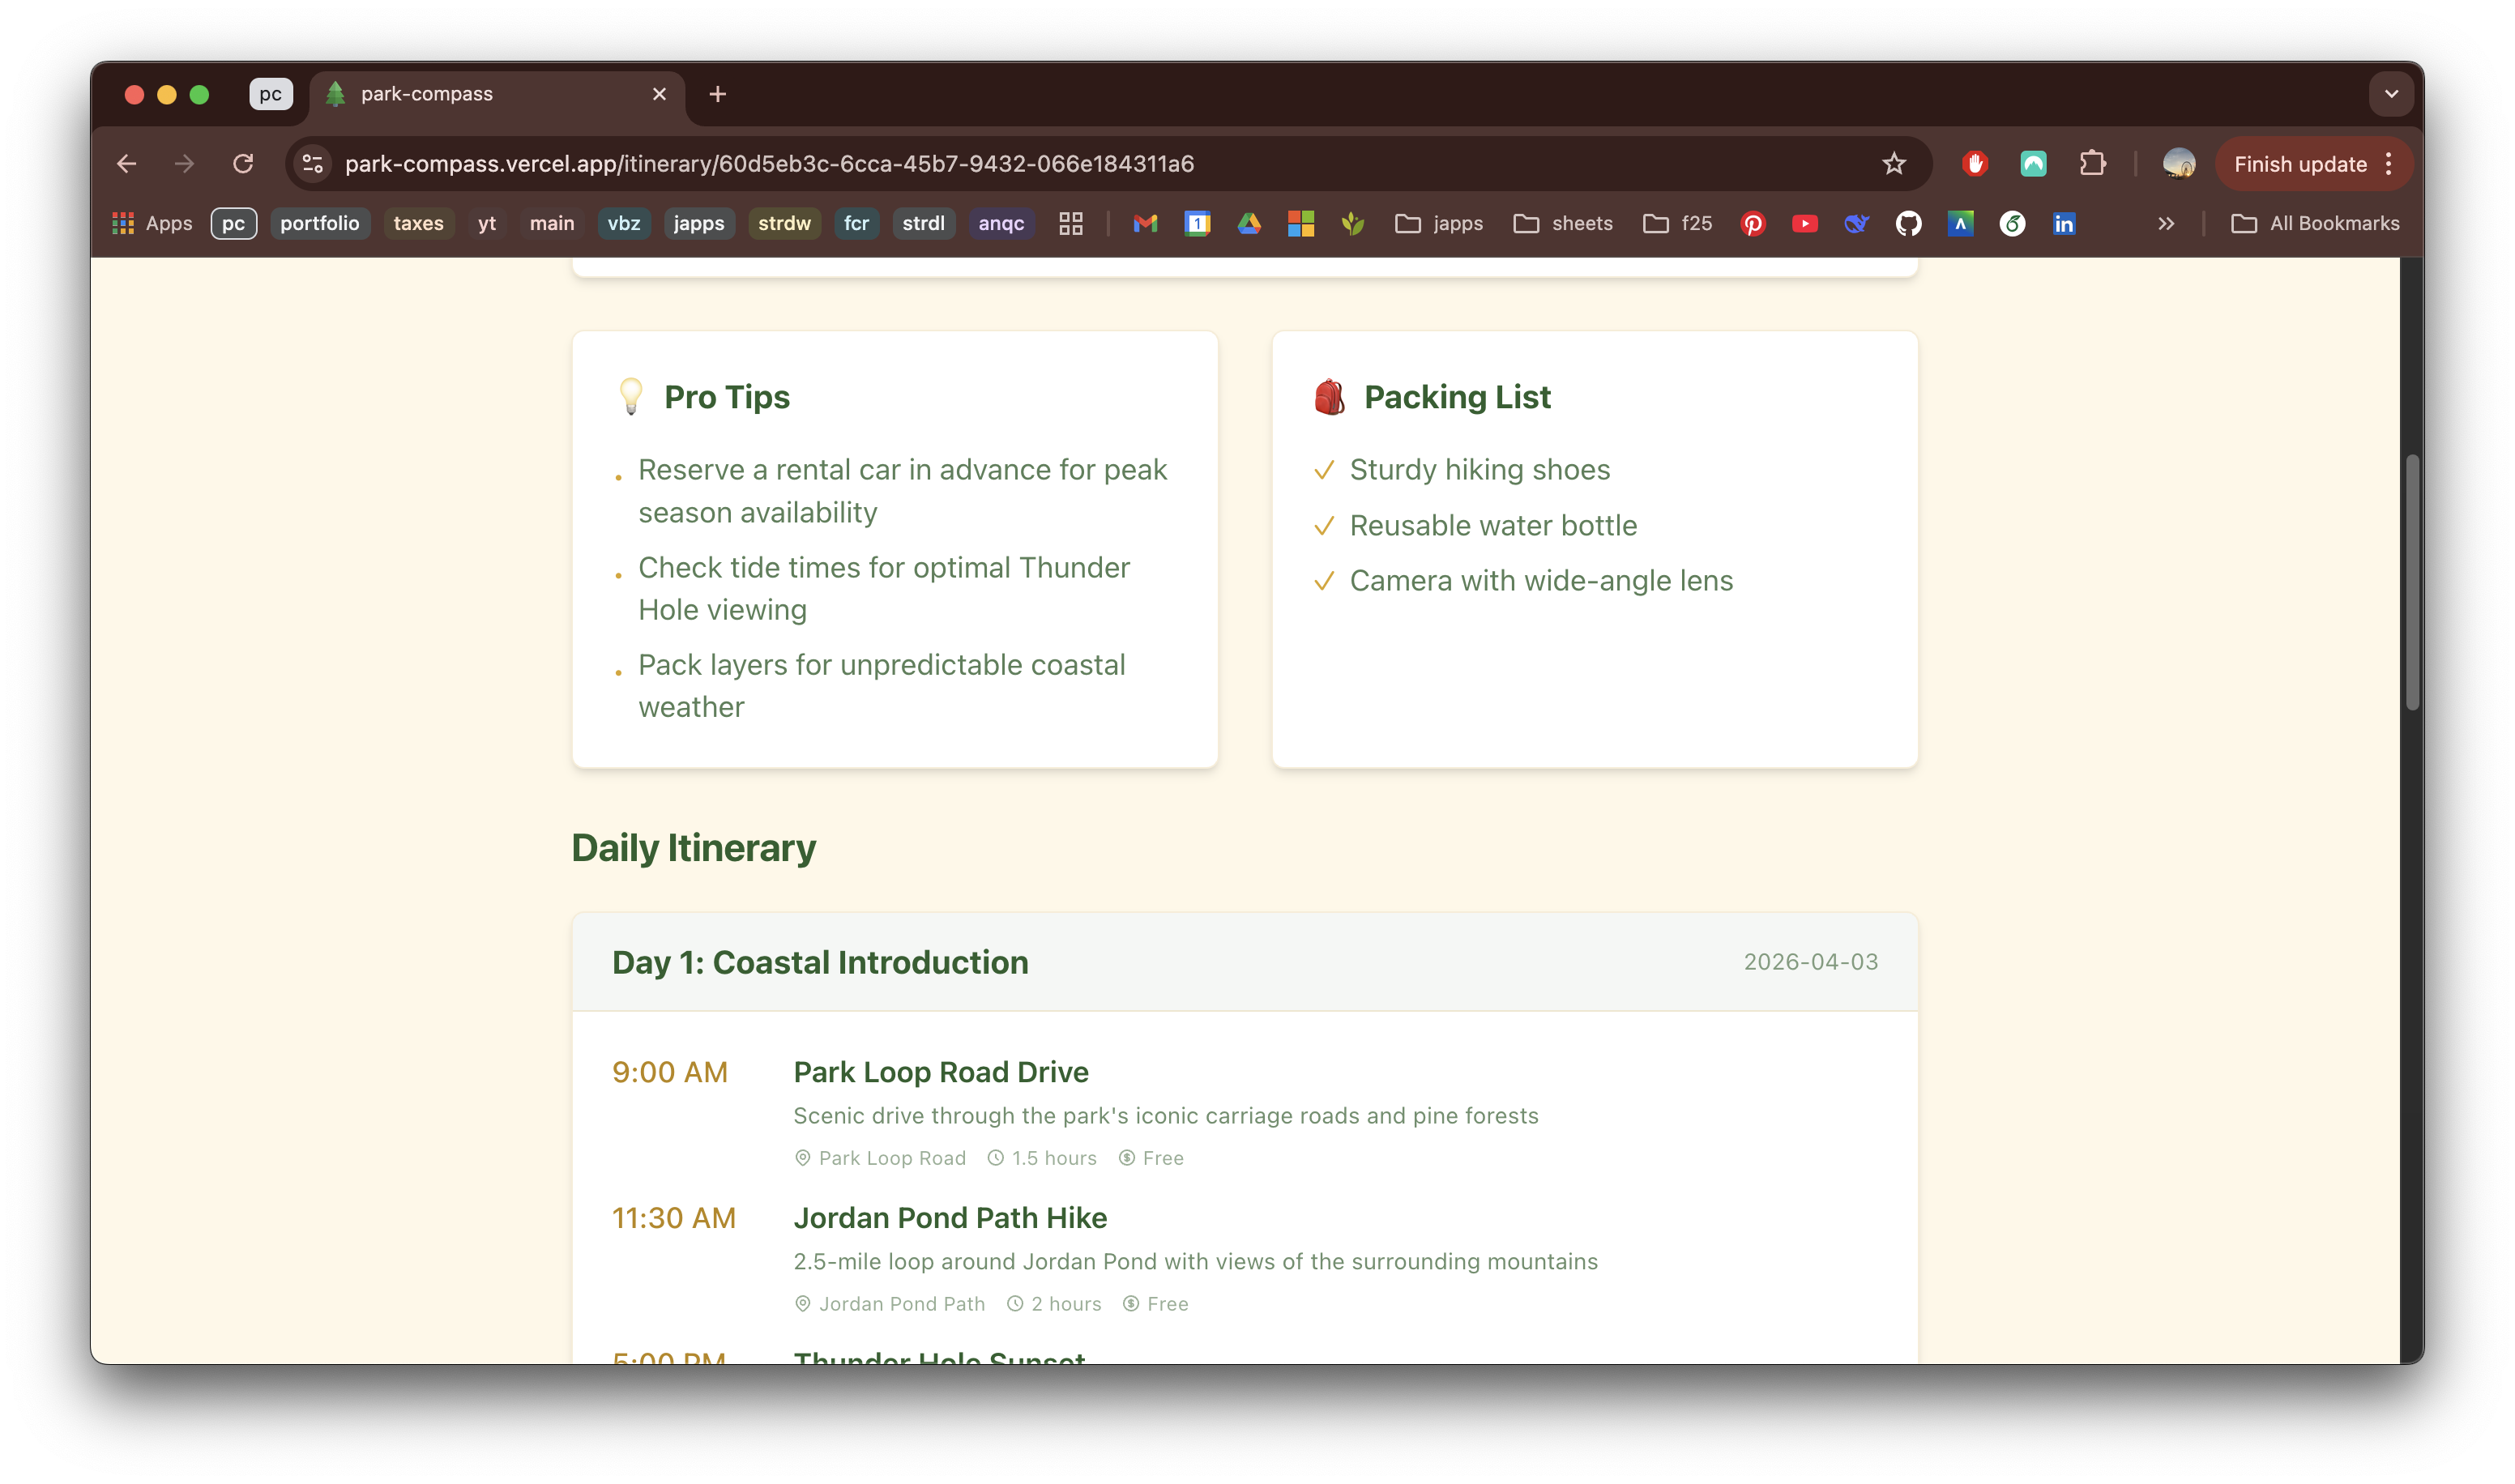
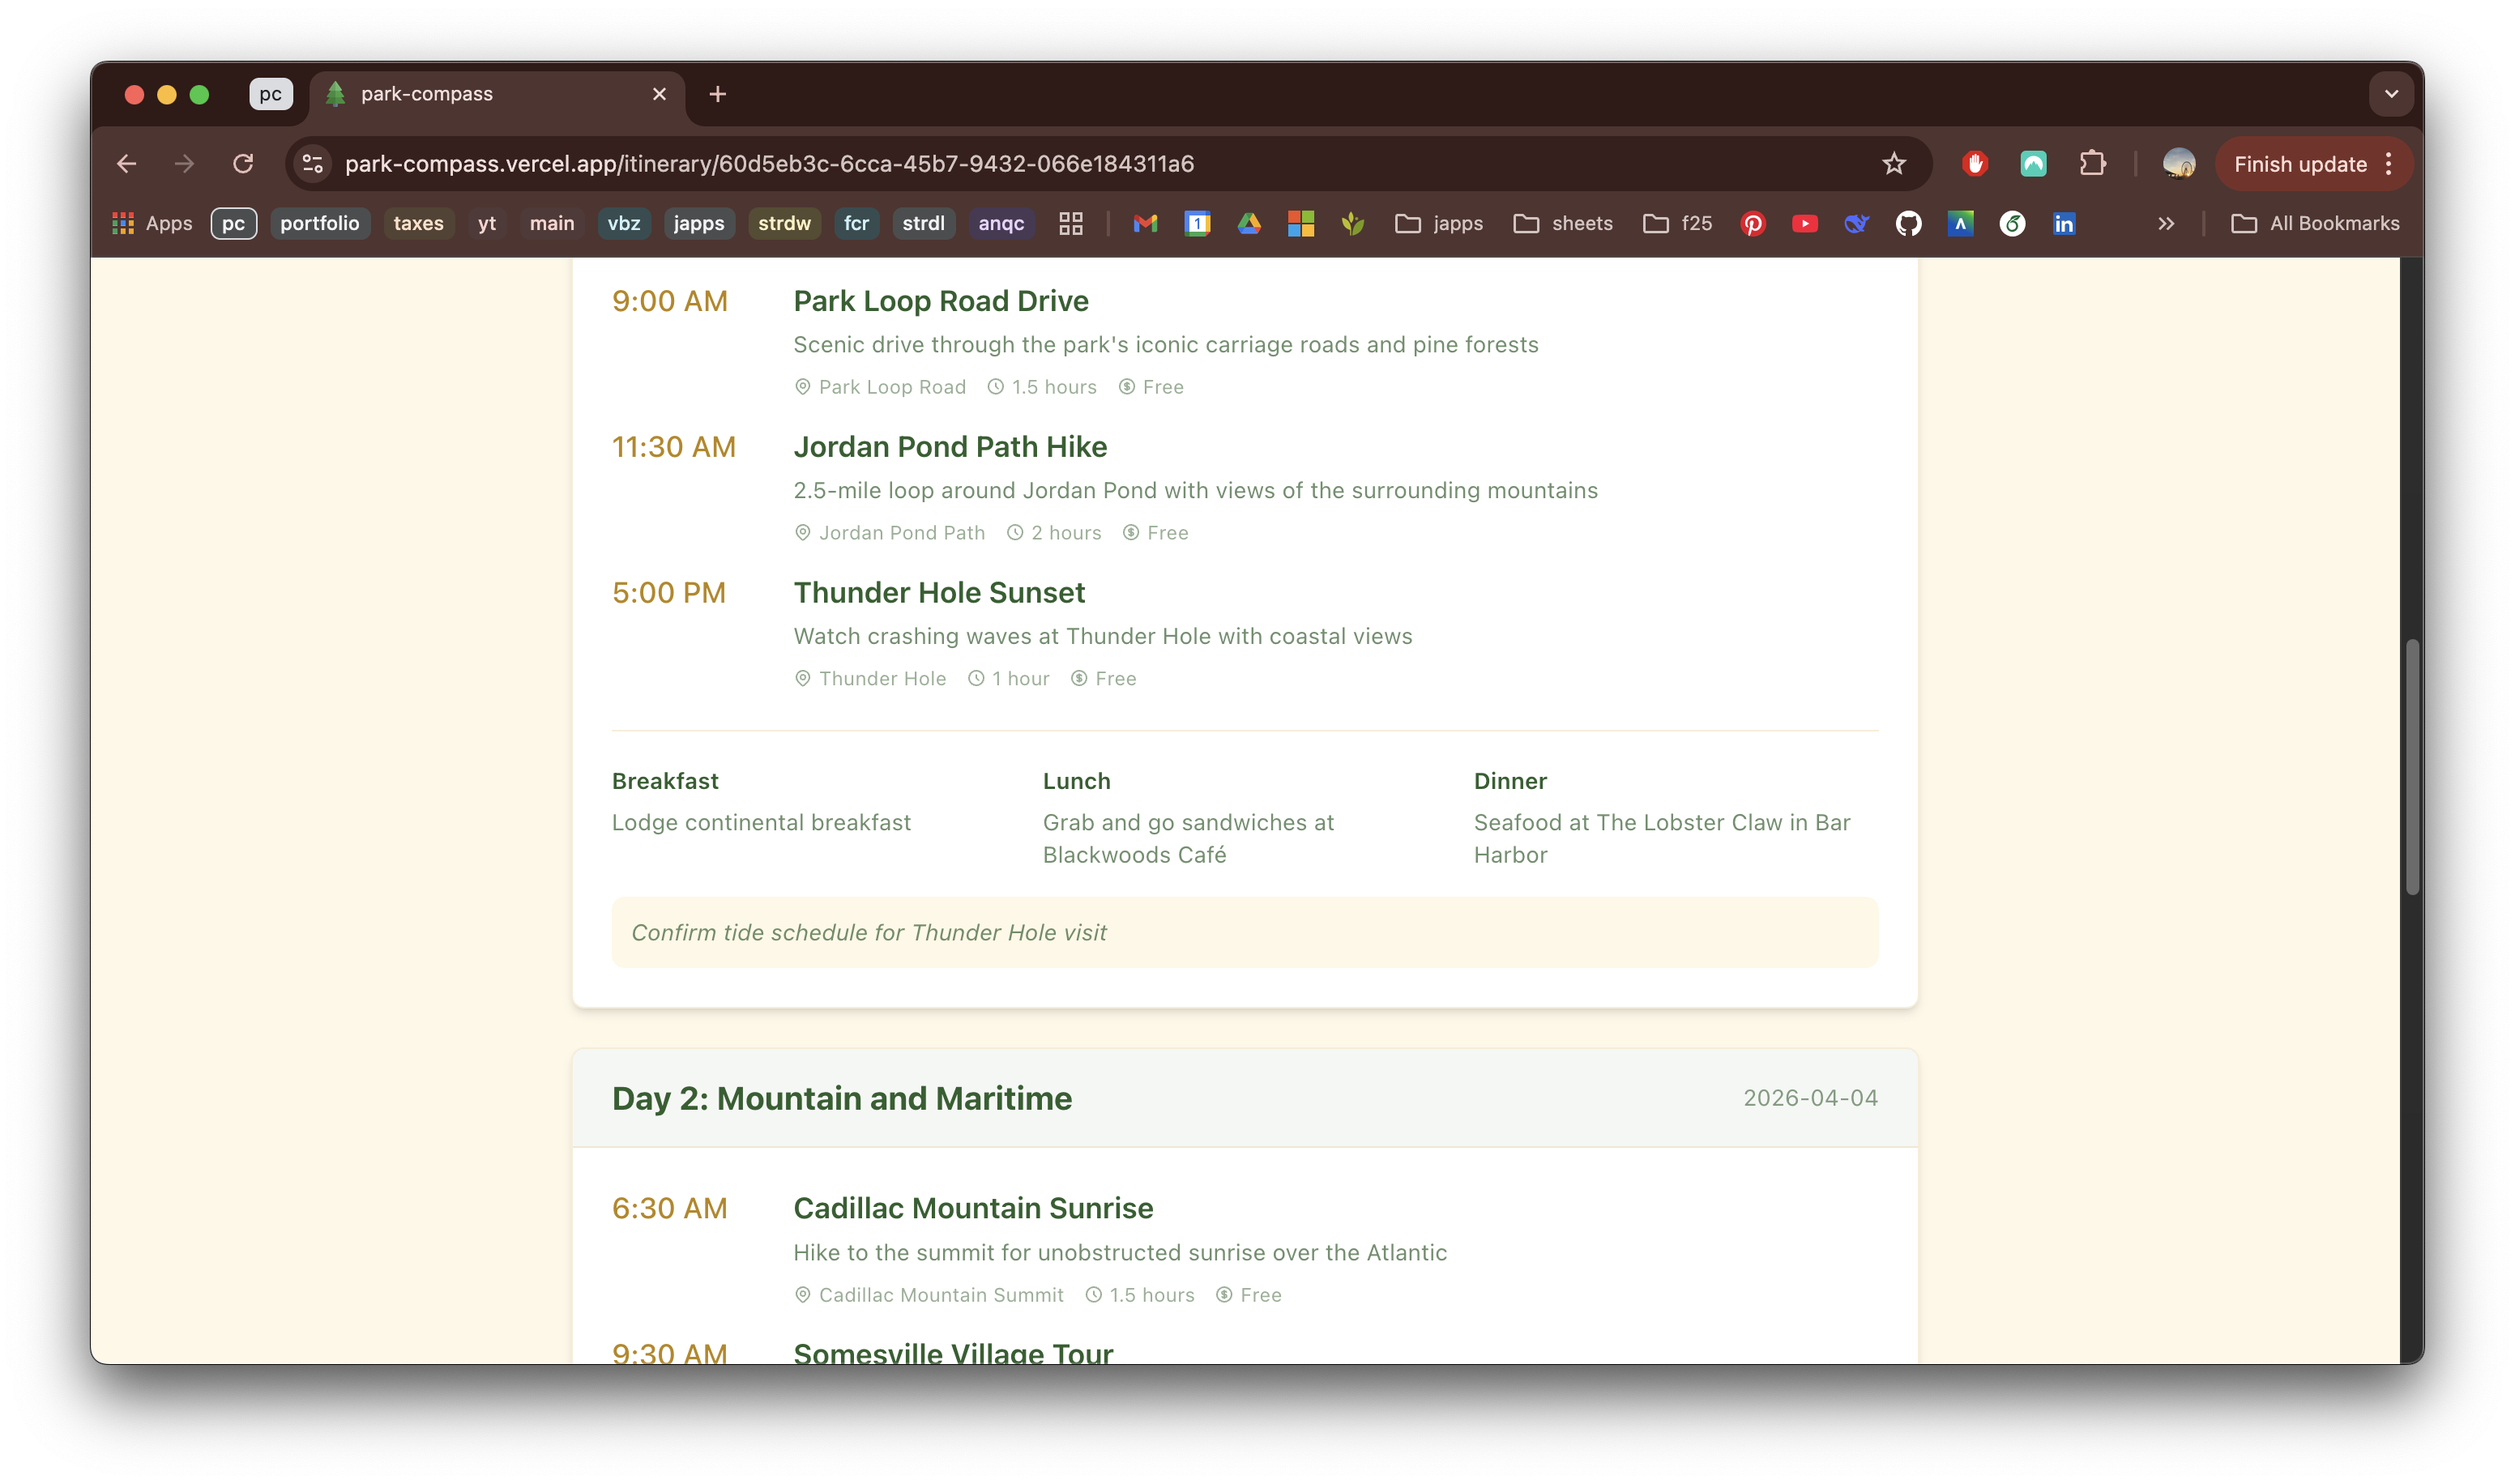
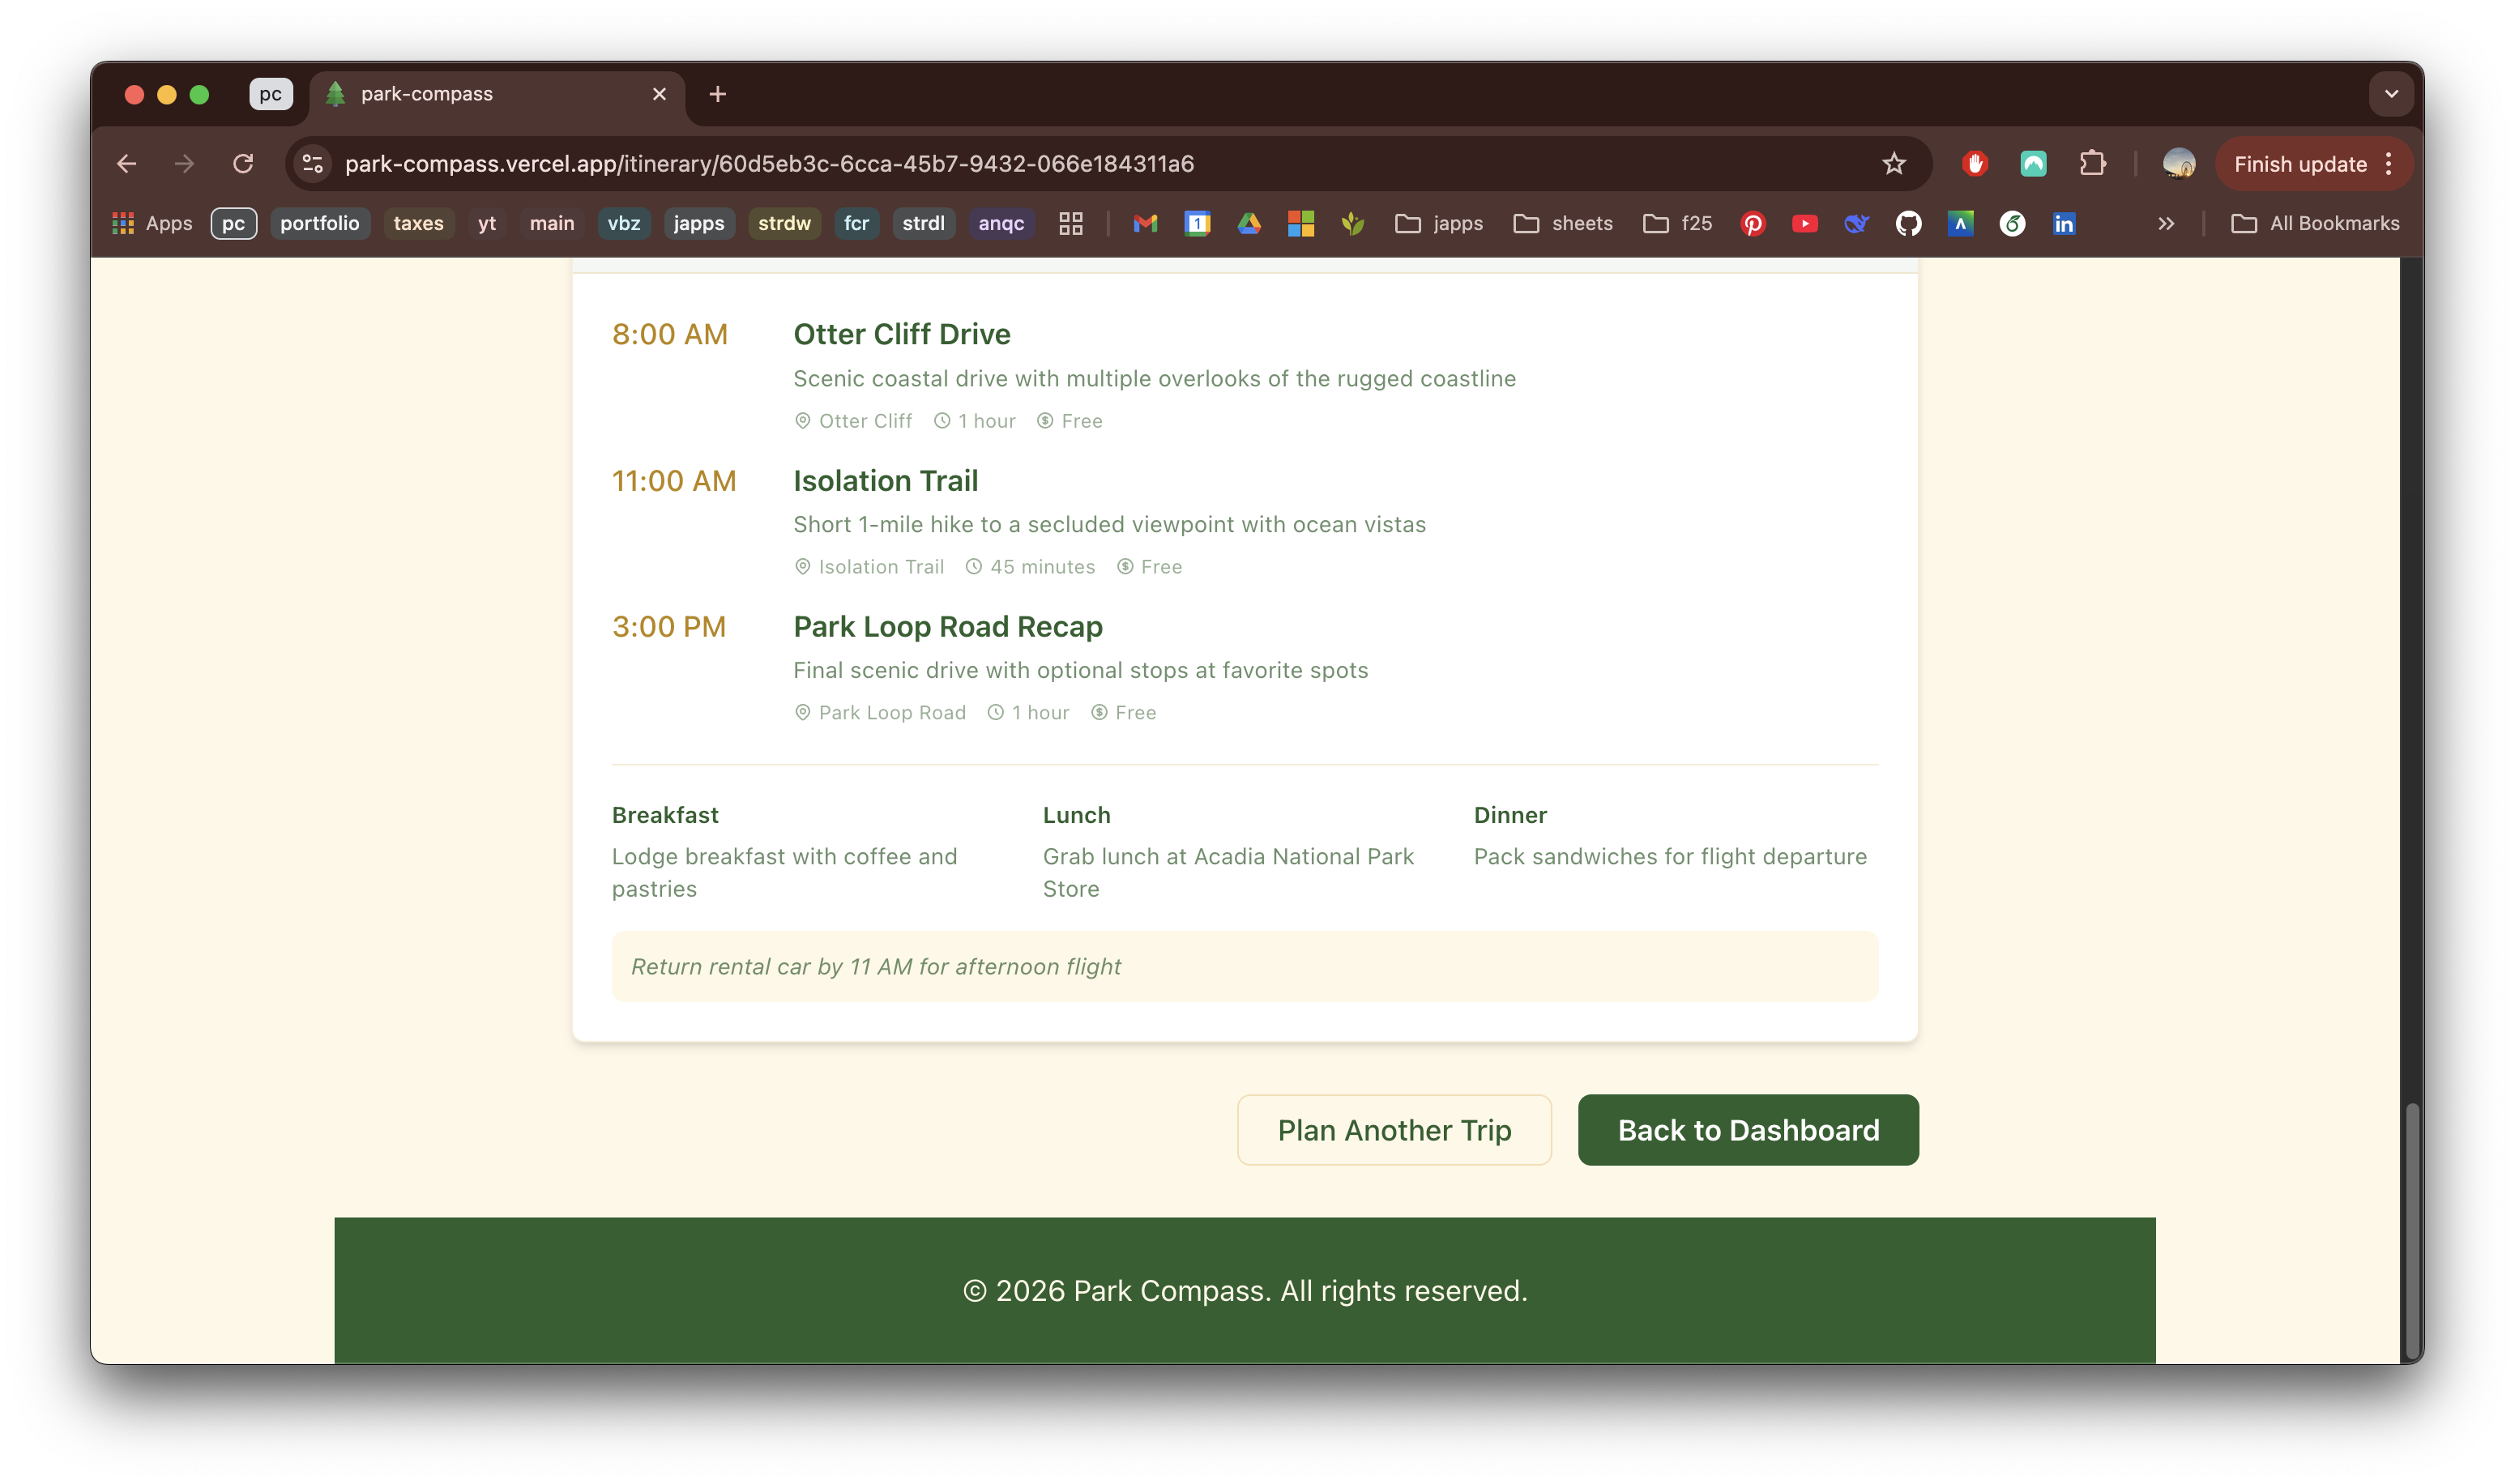
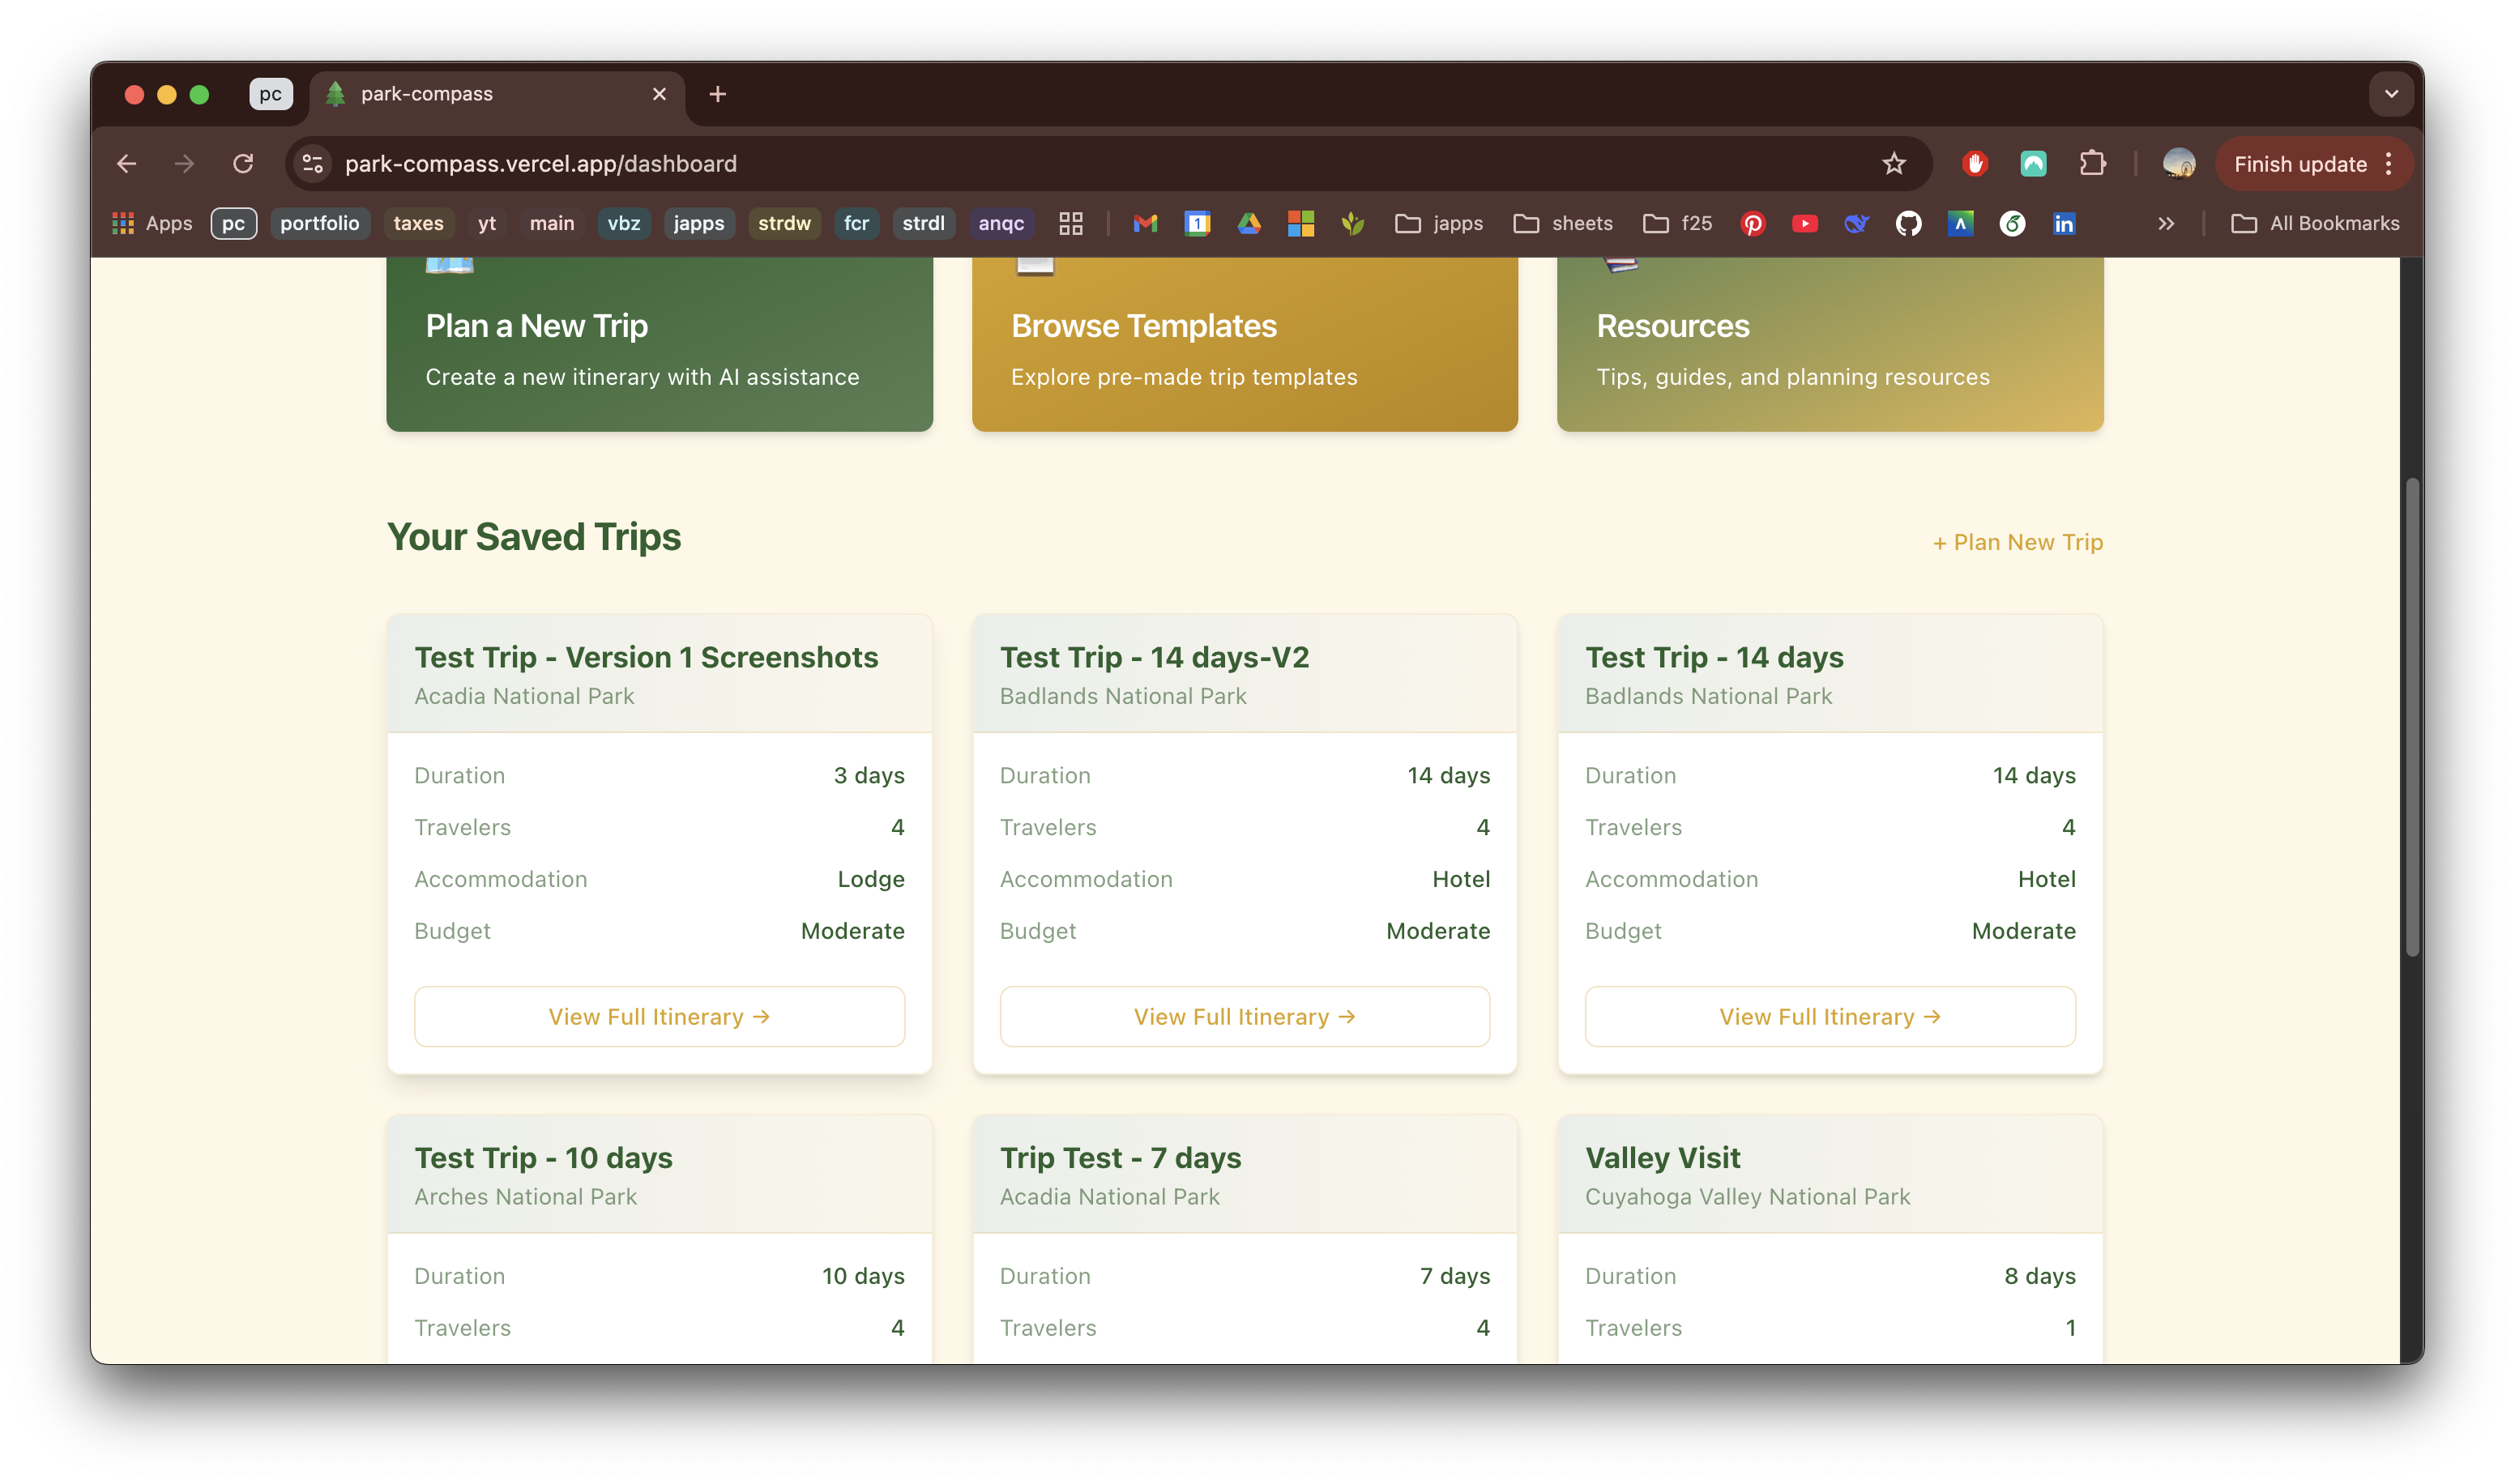
Park Compass is an interactive webapp that helps you discover, plan, and experience America's national parks with intelligent itineraries tailored to your travel style.
Inspiration
- It has been my dream to visit all of the national parks someday! I noticed there were similar pieces of information needed to put together each unique trip itinerary and thought it would be useful if I had a tool that helped streamline the planning process, ensuring all the little details were always taken care of.
- So then when I was thinking about what might make this tool better than already-existing tools, for example, why not just ask a chatbot? Well, sometimes people don't know all of the details they should be planning for, whereas this tool formats itinerary's based on both currently available/suggested itinerarys on the official nation parks website, as well as personal experience, and suggestions from actual travel agents and park volunteers, allowing me to add as many possible details I thought could be useful and necessary when planning a trip like this. Additionally, existing AI assistants are often too generic and require several messages back and forth to get closer to some sort of list/timeline. This tool not only streamlines the process, but also organizes information in a visually appealing, easy-to-navigate alternative while still allowing you to edit and customize your trip details as you go.
- I have a couple family members familliar with/working in the travel industry, and we've had several conversations about the entire travel agent industry and how to an inexperienced traveler, there's absolutely a need for a streamlined platform to help with the planning process.
- I originally had this idea at my last hackathon (HackUTDXII) but had initially only gotten a semi-functional prototype working. I liked this idea so much (and actually want to use it) that I decided to turn it into a fully-fledged tool/resource anyone could use!
- Lastly, I've been wanting to keep up with my technical skills while continuing to learn new things and keep up with the industry. This project provided a perfect scenerio to do so!
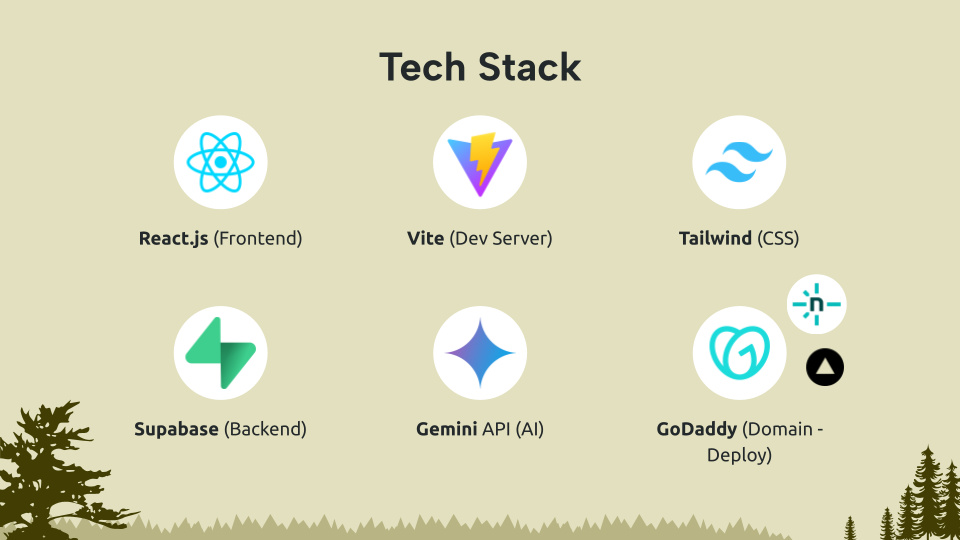
Tech Stack
| Frontend |
- Mapping: starting with lightweight rendering - Mapping: Eventually to switching for more detail later |
|---|---|
| Backend & Services |
- BaaS: database, auth, storage Authentication / GCP Identity Platform LLM gateway |
| AI & Model Layer |
Qwen3-32B (primary model) Other Models/Currently Benchmarking: Benchmarking API Platform |
| Infrastructure & Deployment |
Frontend Hosting |
A couple notes on the Tech Stack:
- Where does the data go & who can see it? All user data is stored securely in Supabase (a cloud-based PostgreSQL database). Each user's personal information and itineraries are private to them only. Data is never shared with third parties or other users.
- What's stored:
- User profile info (email, avatar, name)
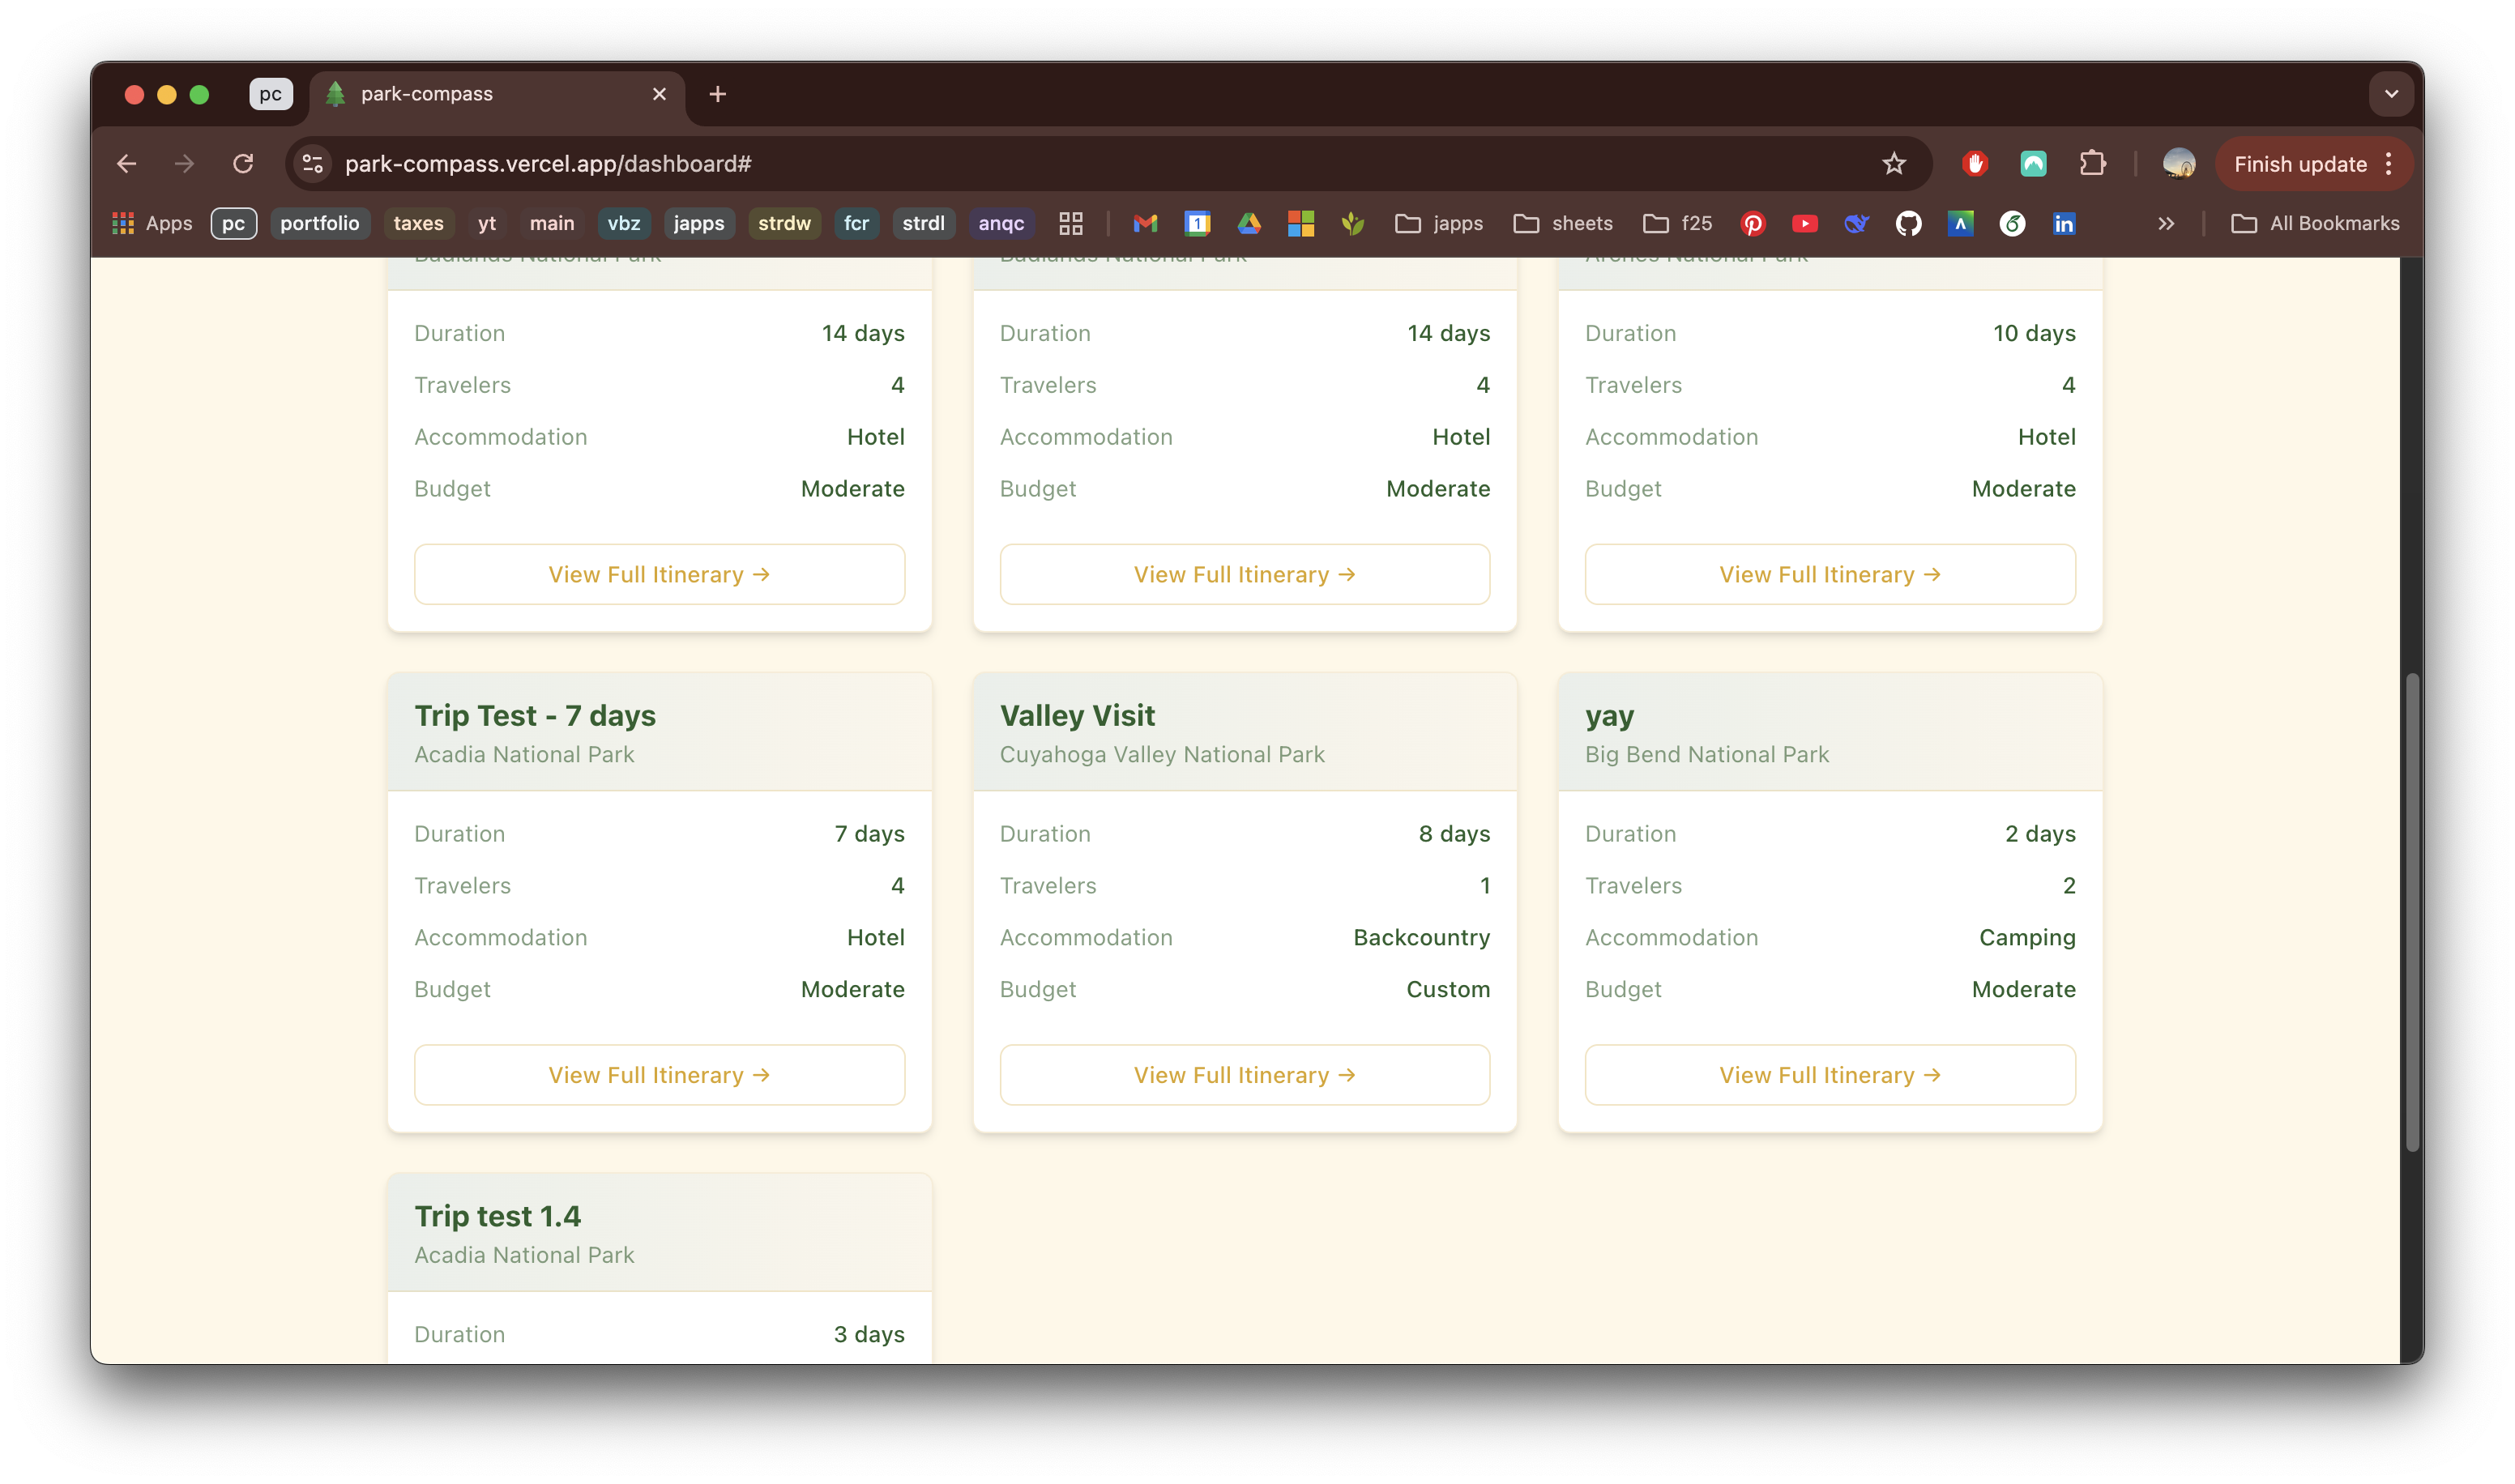
- Saved itineraries (trip plans you choose to save)
- Trip preferences (transportation, budget, accommodation)
- Who can see it:
- You - Only you can access your own saved itineraries.
- Park Compass developers - Cannot see individual user data (only anonymous usage analytics). For example, I can see how many trips were planned for Big Bend National Park, but I can't see which user planned it, nor the trip dates, interests, etc.
- Other users - Cannot see your data at all, though I do plan to add a community feature that allows users to follow each other, where they will eventually be able to see your public profile.
- What's NOT stored:
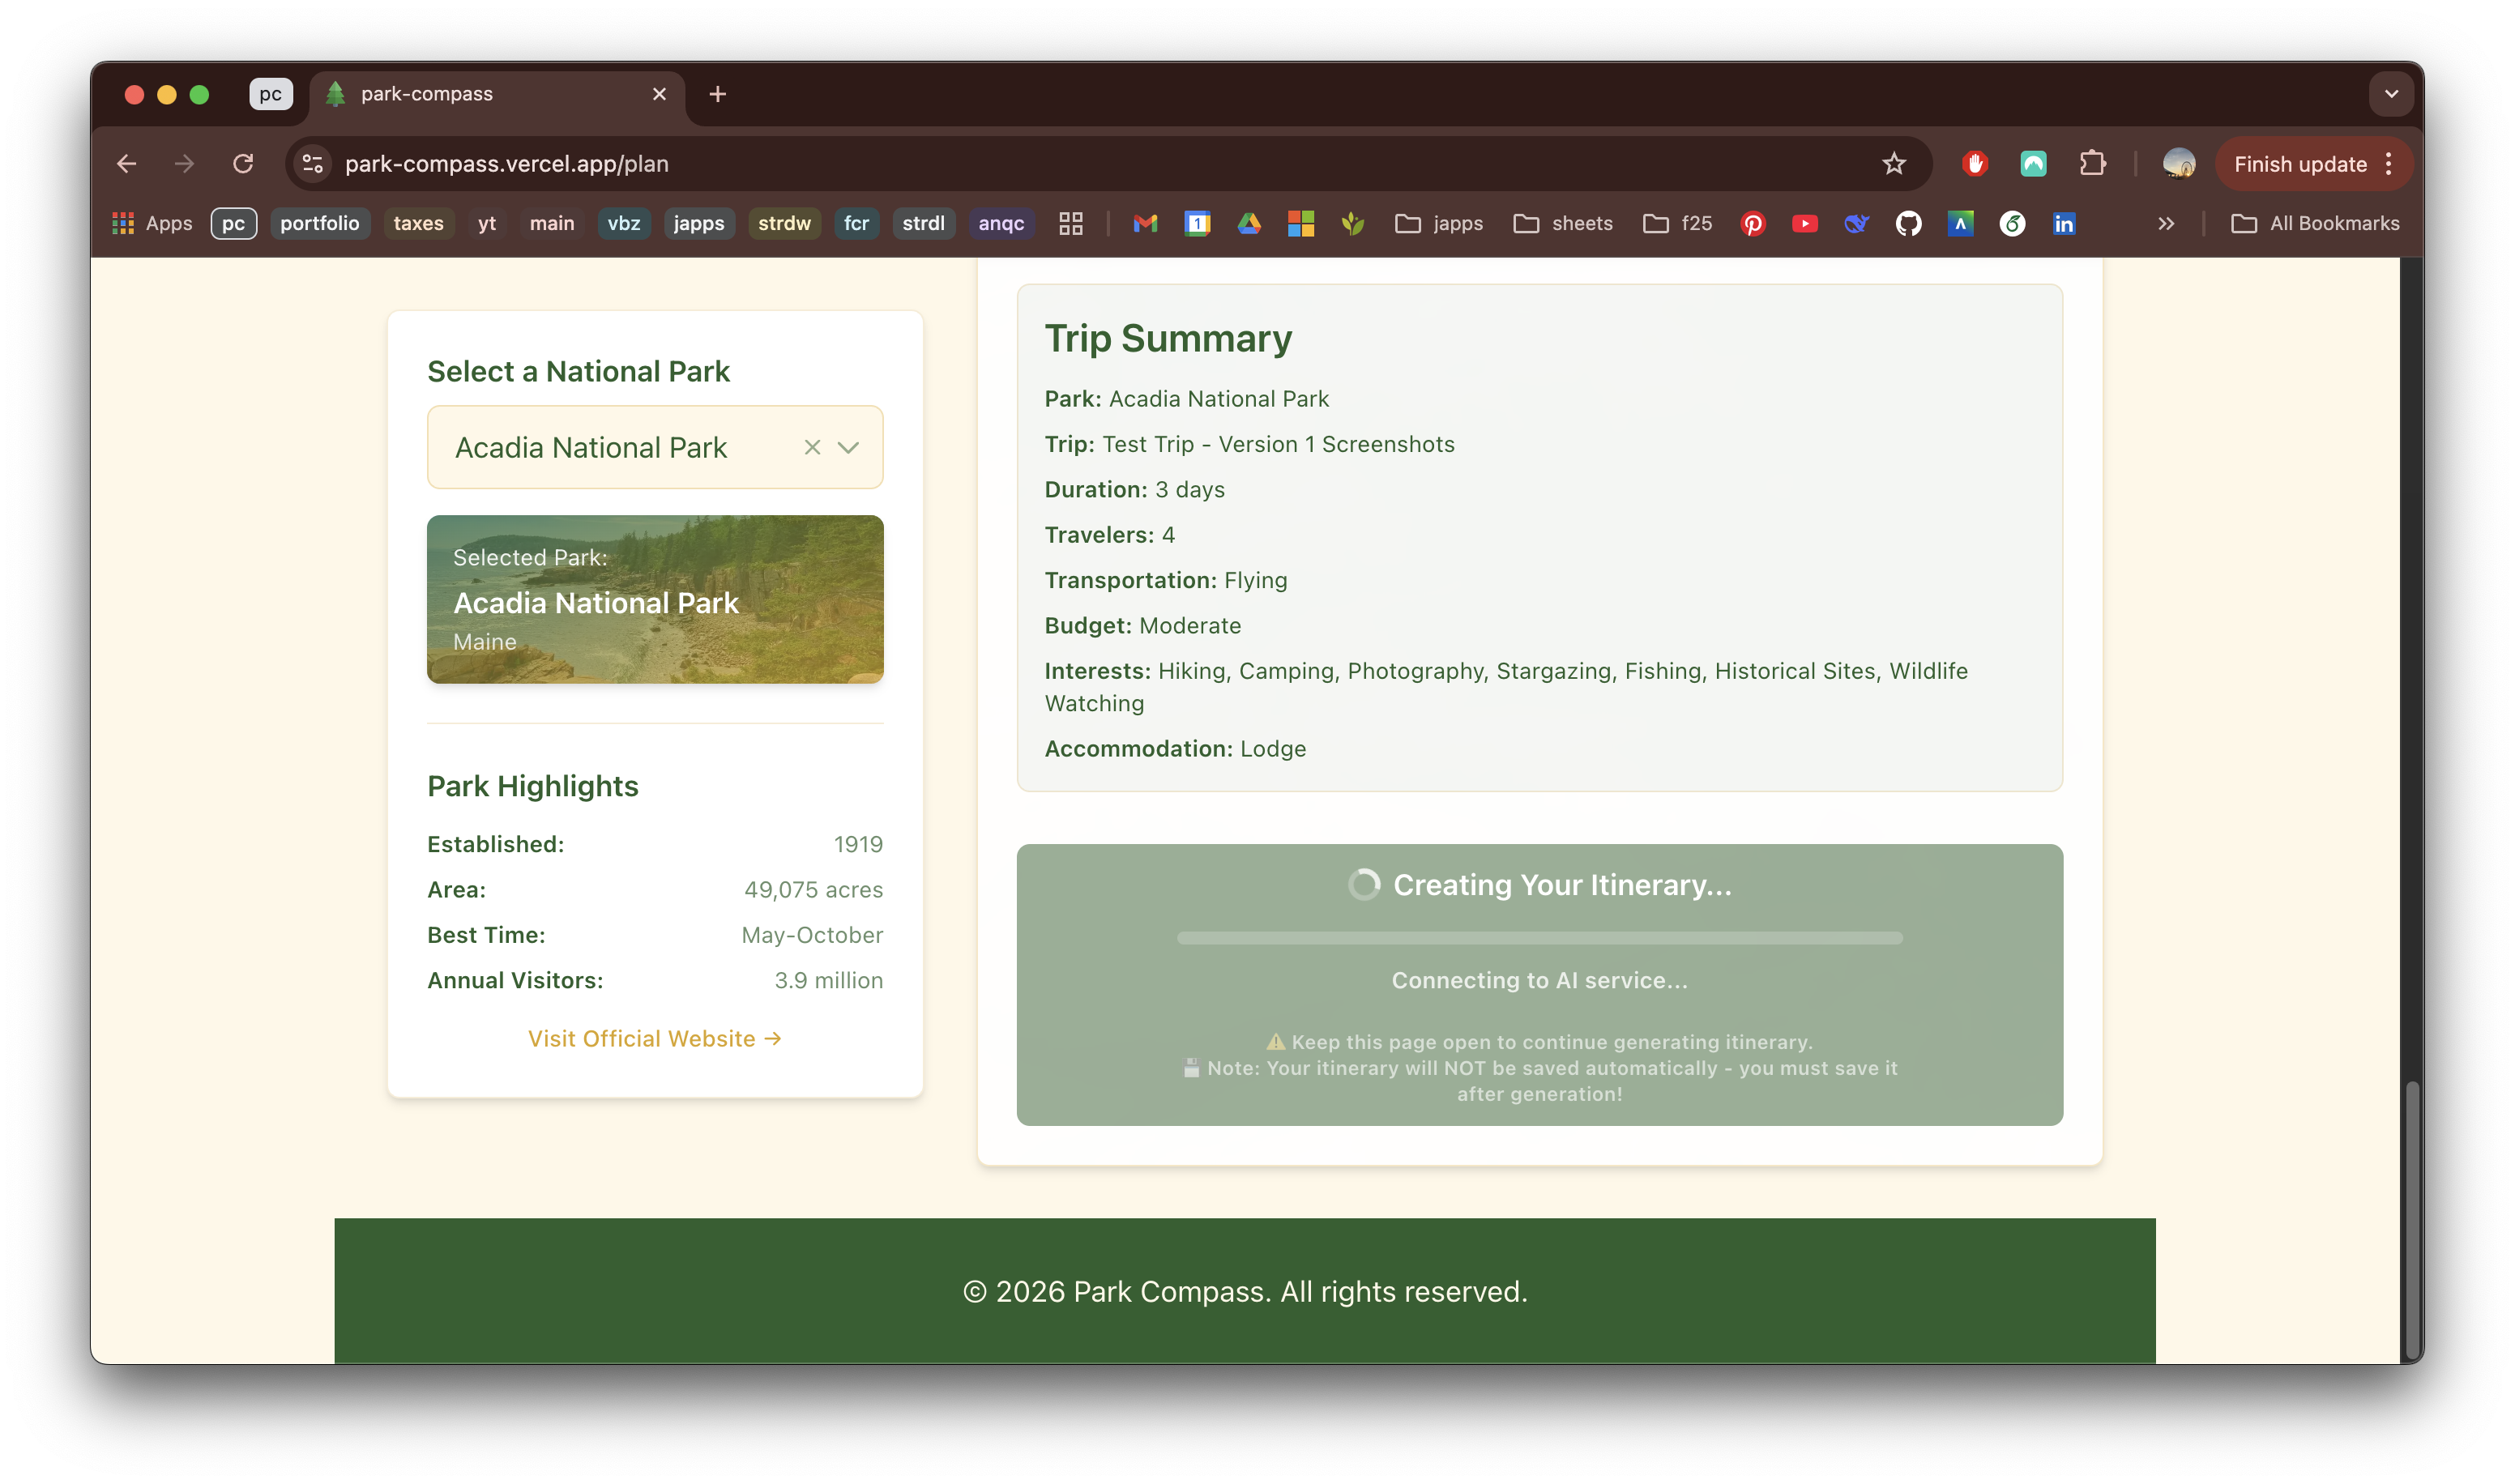
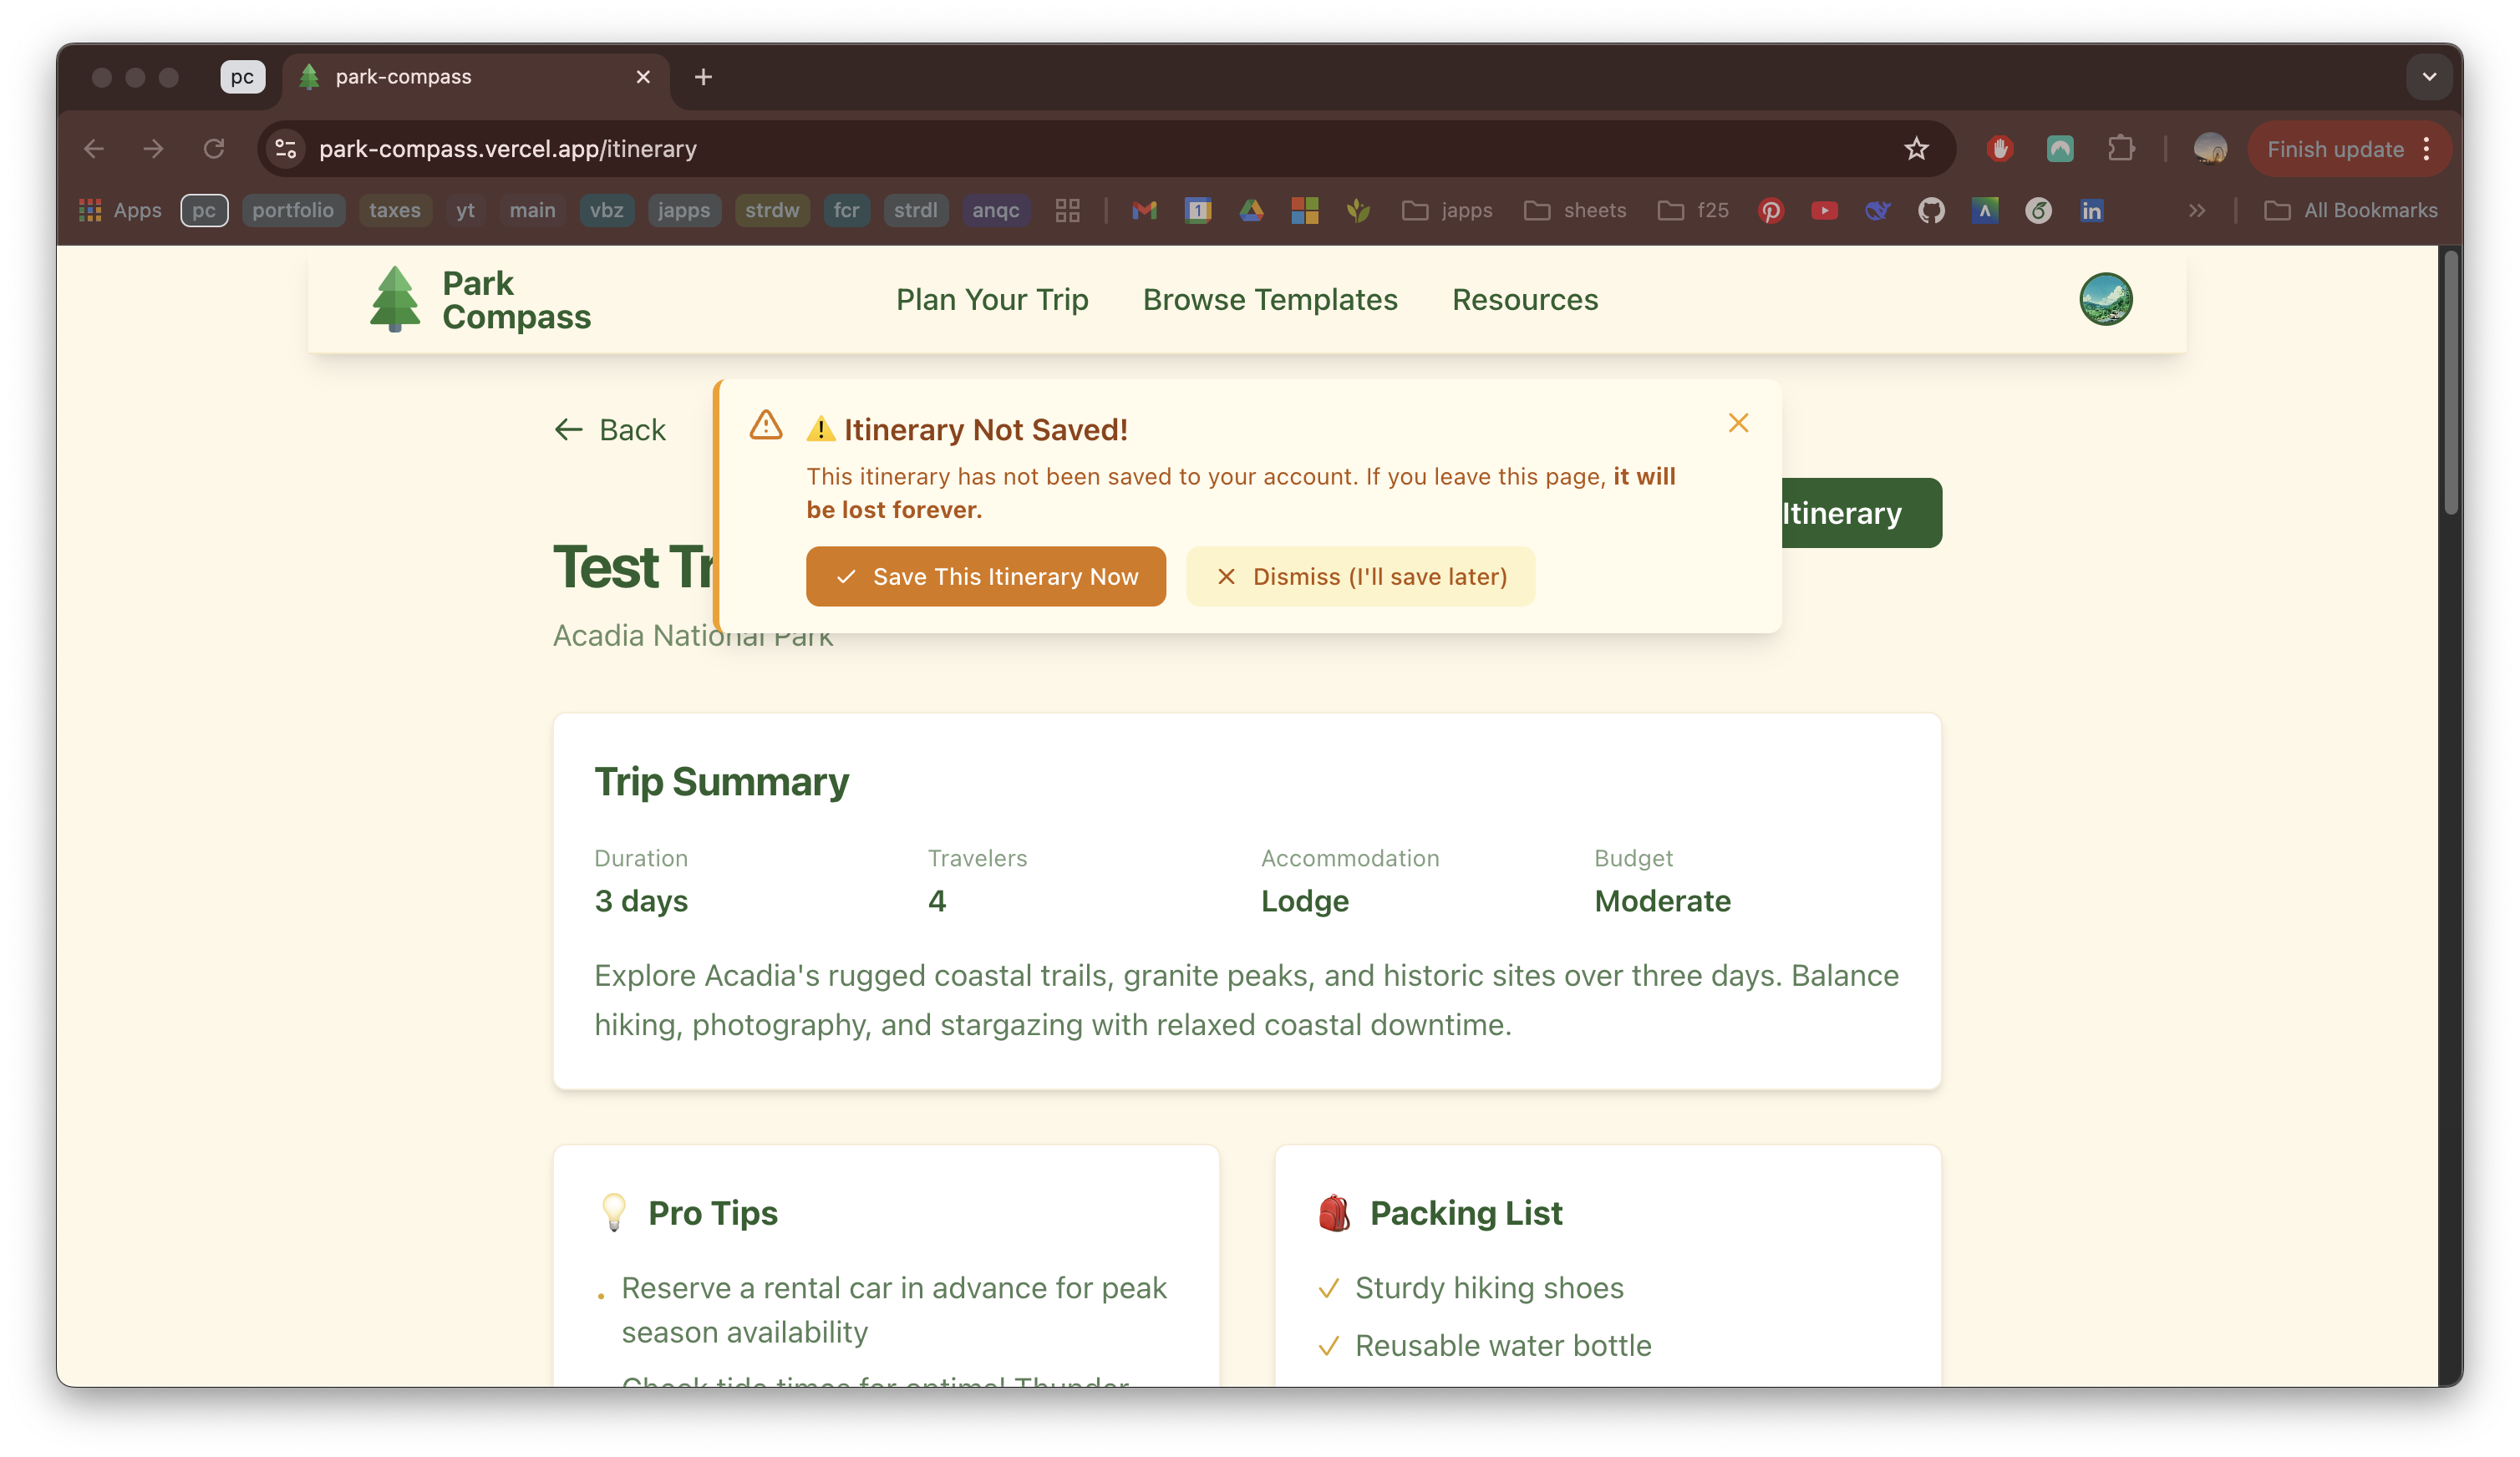
- AI-generated itineraries that you don't explicitly save are automatically deleted when you leave the page.
- Your OpenRouter AI requests are processed in real-time but not stored permanently.
- What about security? Park Compass uses Supabase Row Level Security (RLS) to ensure users can only access their own data. Here's how it works:
- Authentication:
- Email/Password or Google OAuth 2.0 for secure login
- Passwords are hashed using bcrypt (industry standard)
- JWT tokens expire and require refresh
- Row Level Security Policies (example SQL query):
        -- Example: Users can only see their OWN itineraries
        CREATE POLICY "Users can view own itineraries"
        ON itineraries FOR SELECT
        USING (auth.uid() = user_id);
- All API requests require a valid session token
- HTTPS encryption for all data transmission
- Environment variables for API keys (never exposed to client)
- Supabase Edge Functions act as a proxy to OpenRouter (API key hidden from frontend)
- CORS policies restrict unauthorized domains
Short answer: No, your data is NOT training the AI model.
Long answer: Park Compass uses OpenRouter to access the Qwen 3-32B model. Here's the truth about AI training:
| Platform | Trains on your data? |
|---|---|
| Park Compass (OpenRouter) | NO - Your data is NOT used for training |
| ChatGPT (free tier) | YES - Can use your conversations for training |
| ChatGPT (paid/API) | NO - API data is not used for training |
| Claude (free) | Yes, with opt-out options |
| Gemini (free) | Yes, with privacy settings |
What this means for you:
- The park information, dates, and preferences you enter are sent ONLY to generate your itinerary.
- OpenRouter's API policy states: "We do not use API inputs and outputs to train our models"
- Your data is processed in real-time and not retained for model improvement
Important disclaimer: While Park Compass protects your data, be cautious with any online tool. Never enter sensitive information like credit cards, social security numbers, or passwords into ANY AI chatbot - even "secure" ones can have vulnerabilities.
How we're improving accuracy:
- Coming soon: Embedded links to official sources (NPS websites, reservation pages, activity details) so you can verify information with one click.
- Coming soon: References at the bottom of each section showing exactly where information came from, including full url links for printed pdf option.
- Use Park Compass as an inspiration and planning tool
- Always verify operating hours, fees, and reservation requirements on official park websites
- Check current weather, trail conditions, and alerts before your trip
- Call ahead for accommodations and activity availability
This is YOUR trip. No AI can replace your own research, local knowledge, and personal preferences. Think of Park Compass as a knowledgeable friend who suggests ideas, but you're still the expert on what works best for you.
The golden rule of AI trip planning:
Never rely on one tool solely to do the work for you. Use AI to generate ideas, then verify with official sources.
Planning Phase/Hackathon Notes
As I mentioned earlier, this project was originally a hackathon idea. Here are some of the original planning steps I took while brainstorming:
Systems Architecture
Happy Flow User Journey
In-Depth User Flow
Info Architecture
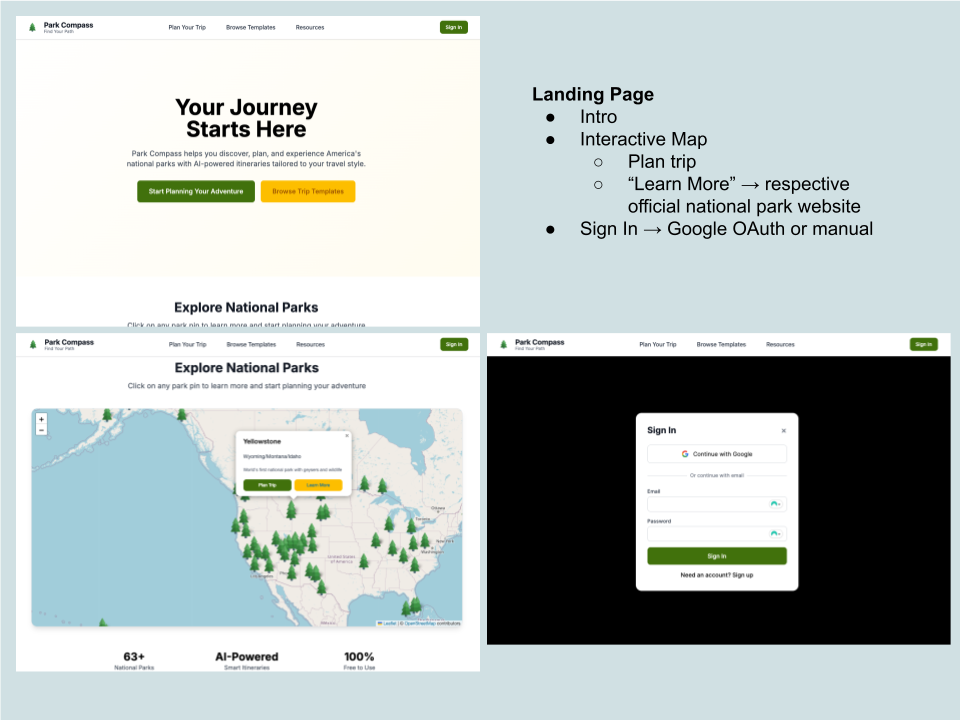
Landing Page Wireframes

Planning Page Wireframes
Hackathon Presentation - Slide 1
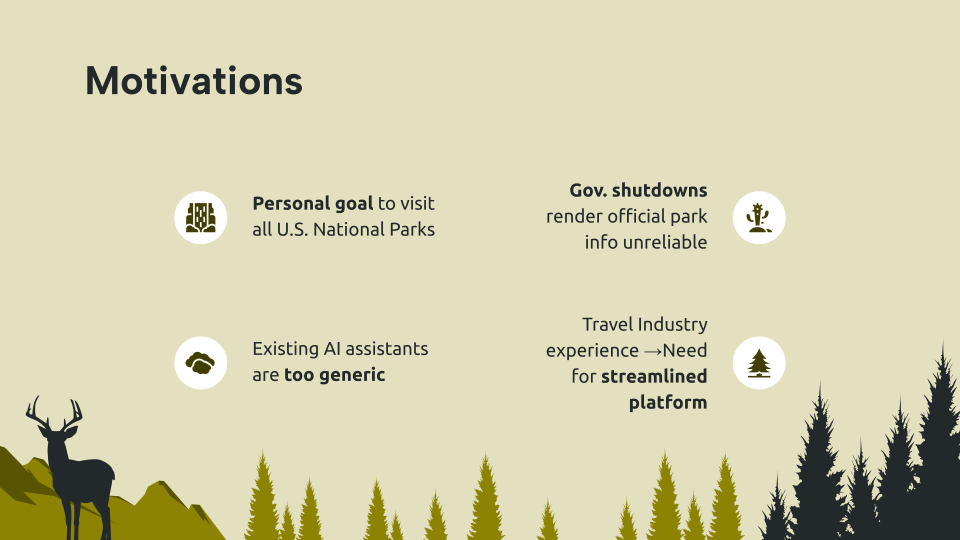
Hackathon Presentation - Slide 2
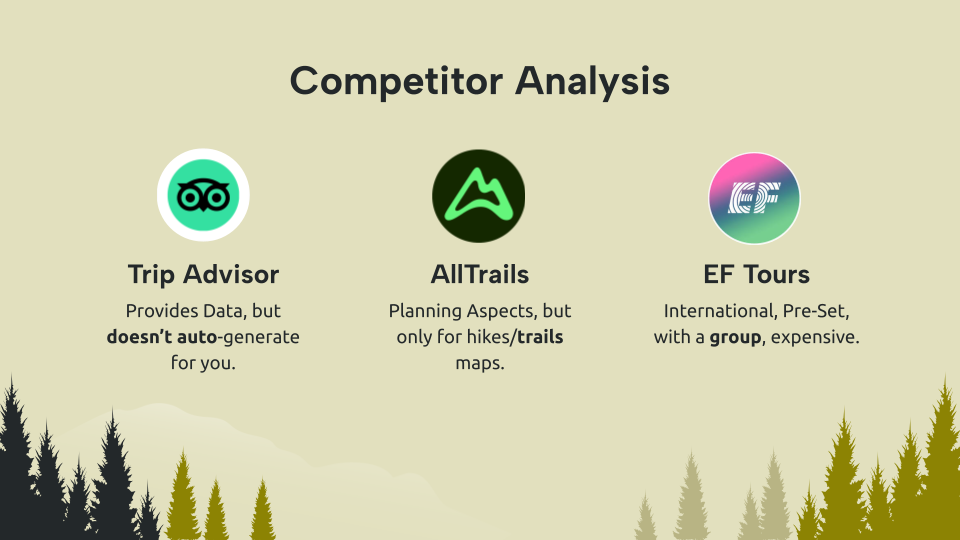
Hackathon Presentation - Slide 3
Hackathon Presentation - Slide 4
Hackathon Presentation - Slide 5
Hackathon Presentation - Slide 6
Hackathon Presentation - Slide 7
Hackathon Presentation - Slide 8
Version Iterations
Checkout the current version of the site: https://park-compass.vercel.app/
Version 1

Limitations
| Limitation | Why | Impact |
|---|---|---|
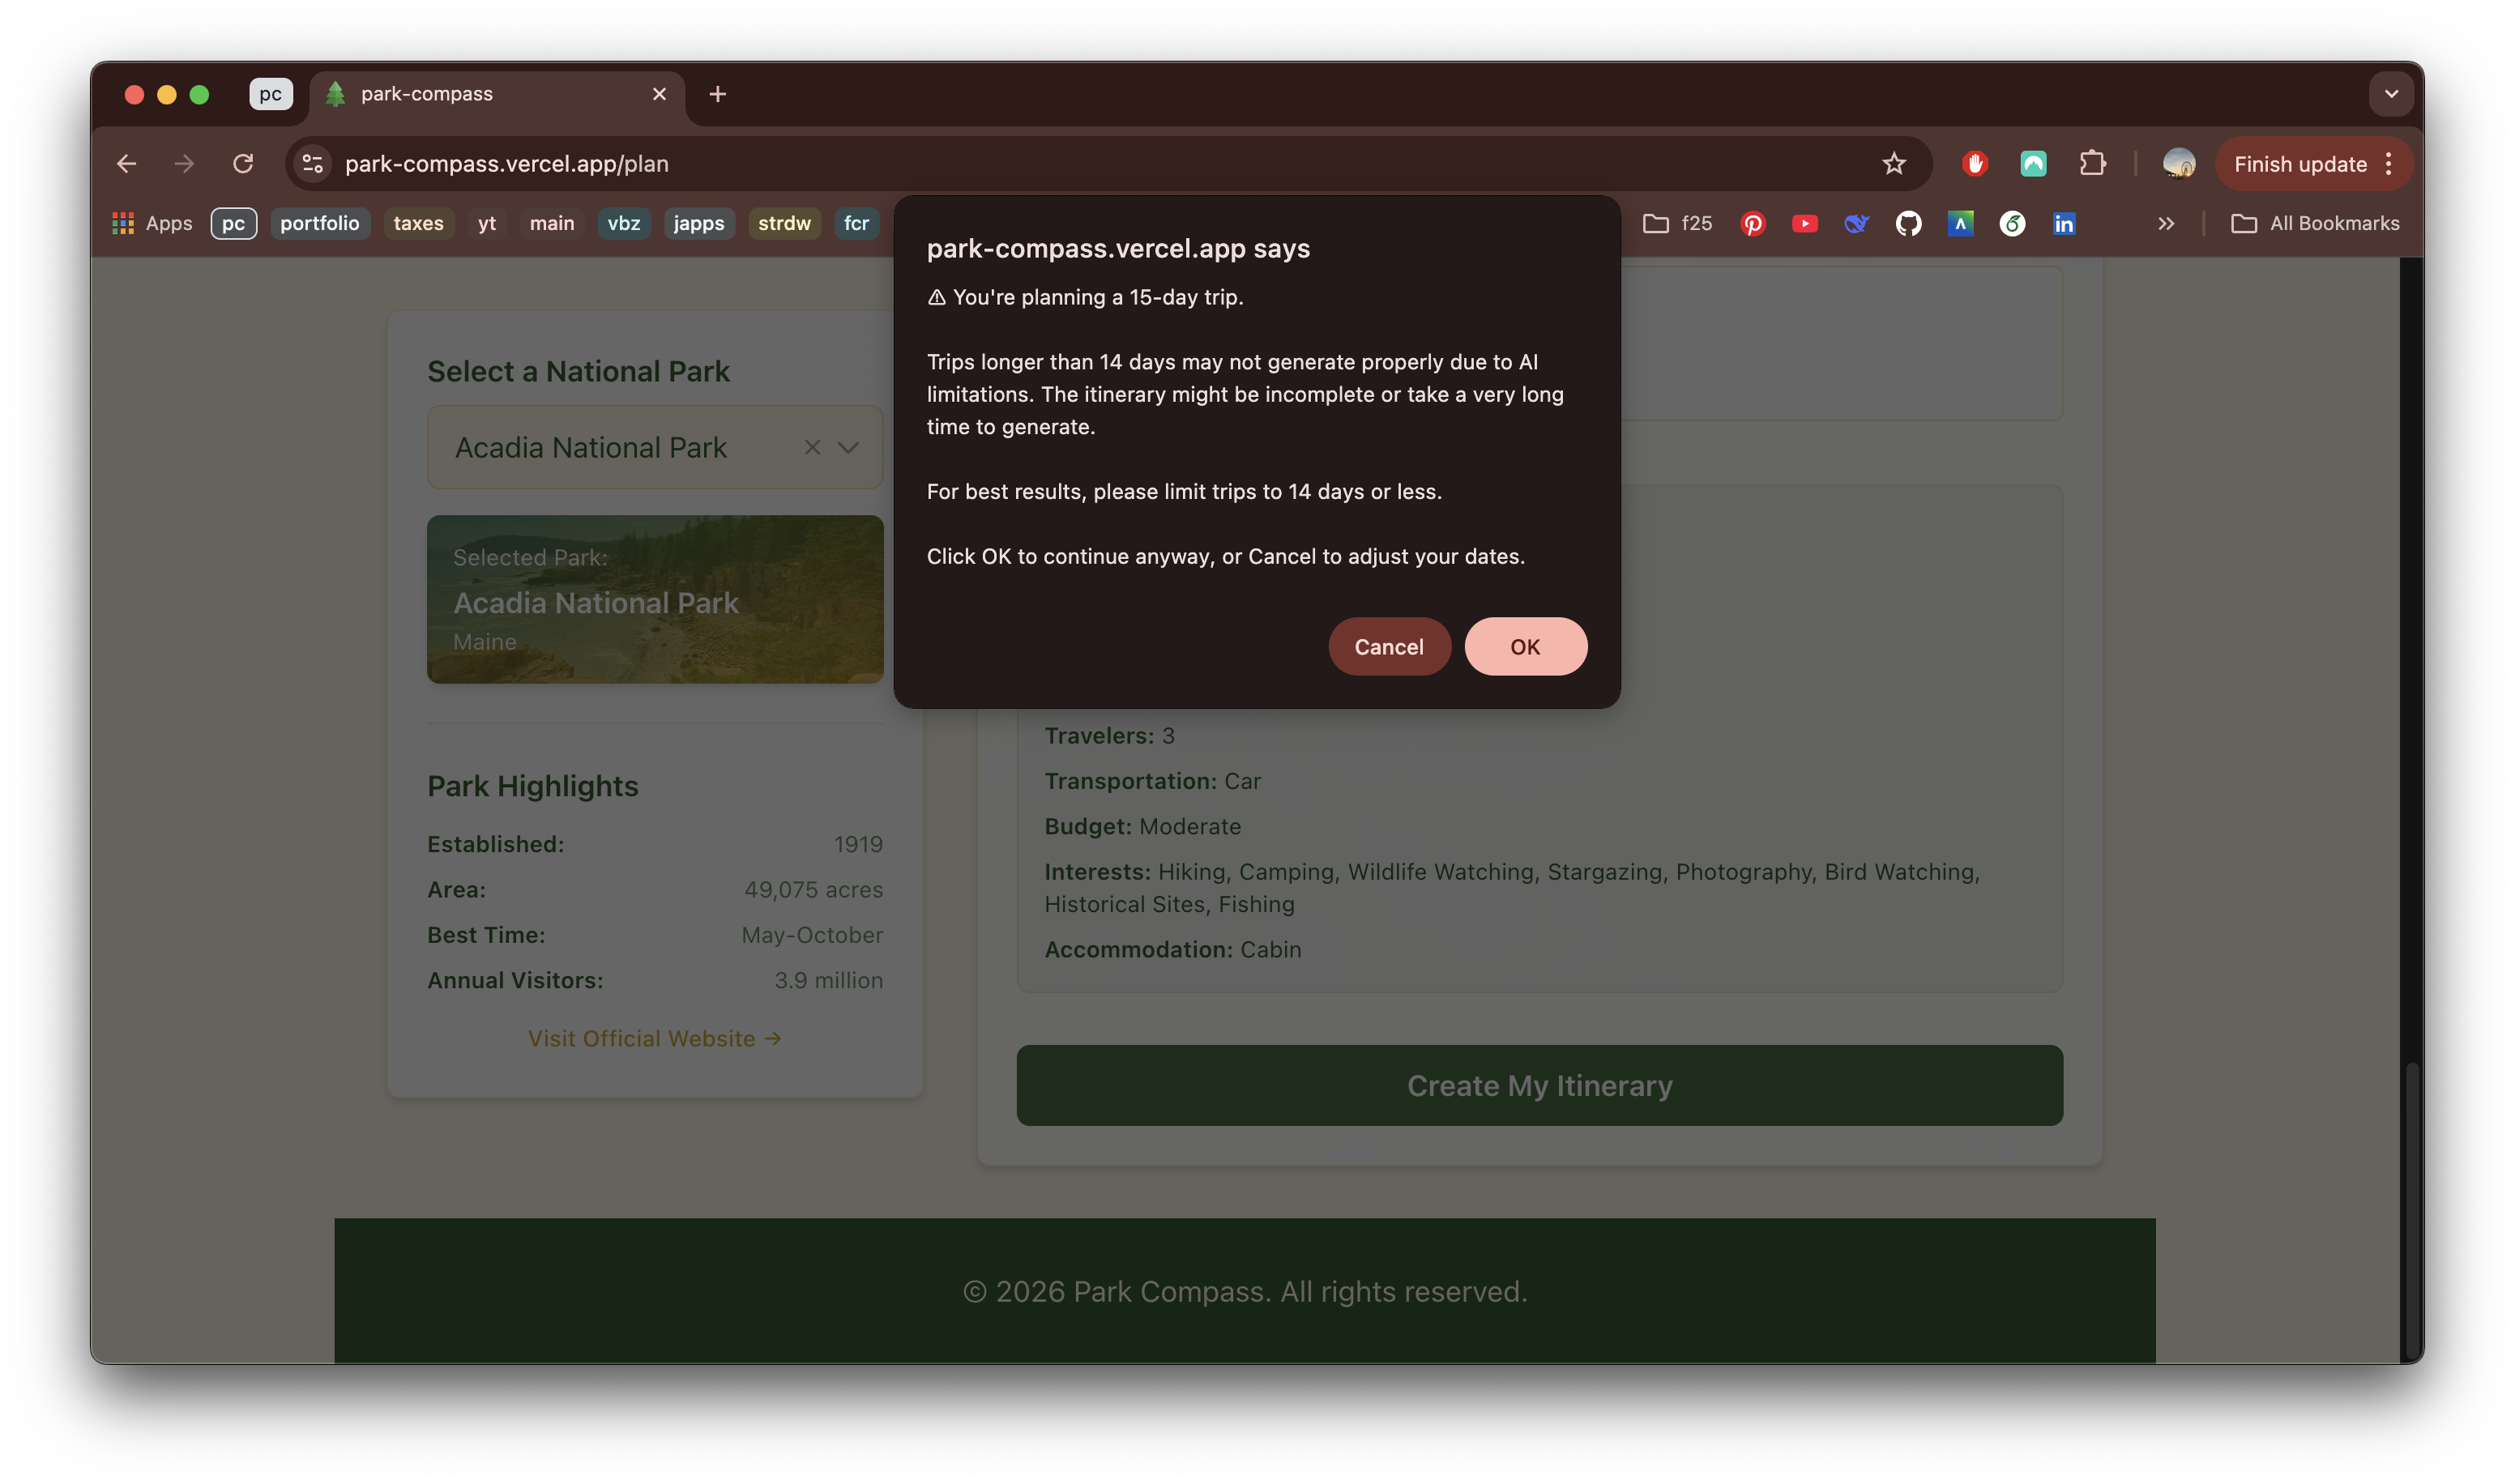
| Token limits | OpenRouter free tier caps response length | Trips >12 days may truncate |
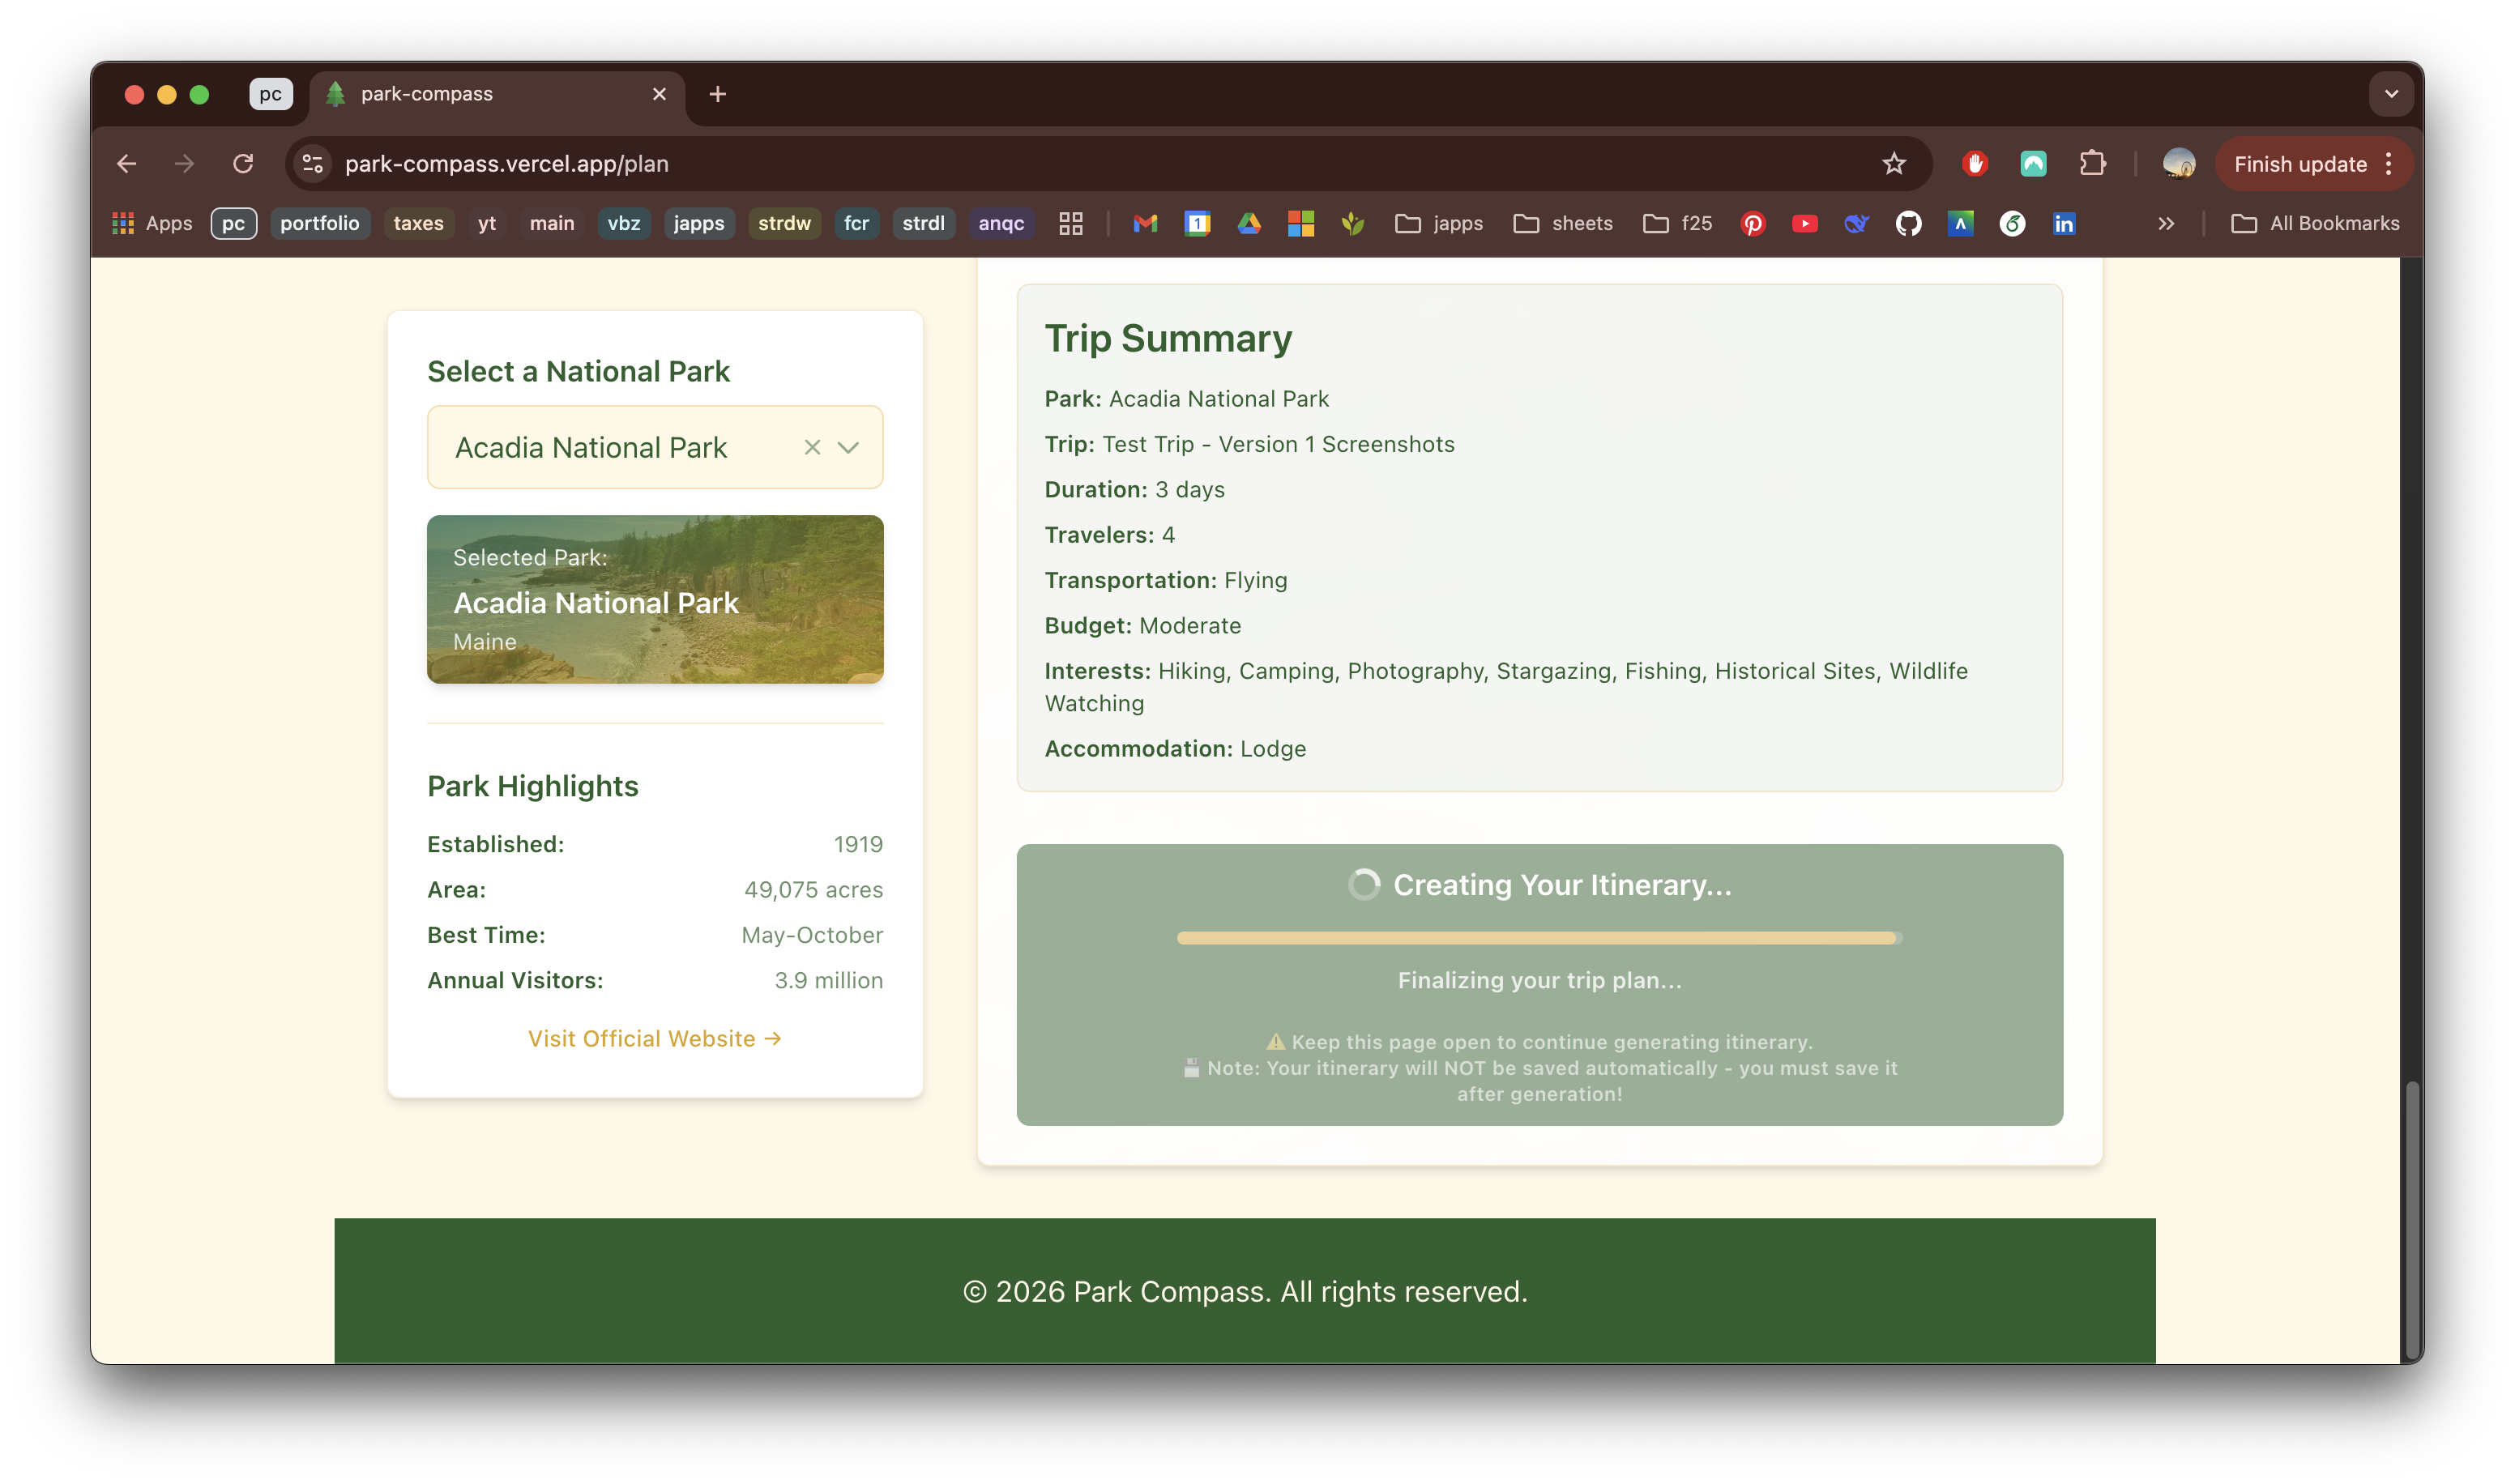
| Latency | Qwen model + free API tier | 15-45 second generation time |
| Rate limiting | Shared API resources | May queue during peak usage |
| Storage | Supabase free tier (500MB) | ~50 saved itineraries per user |
Current Solutions:
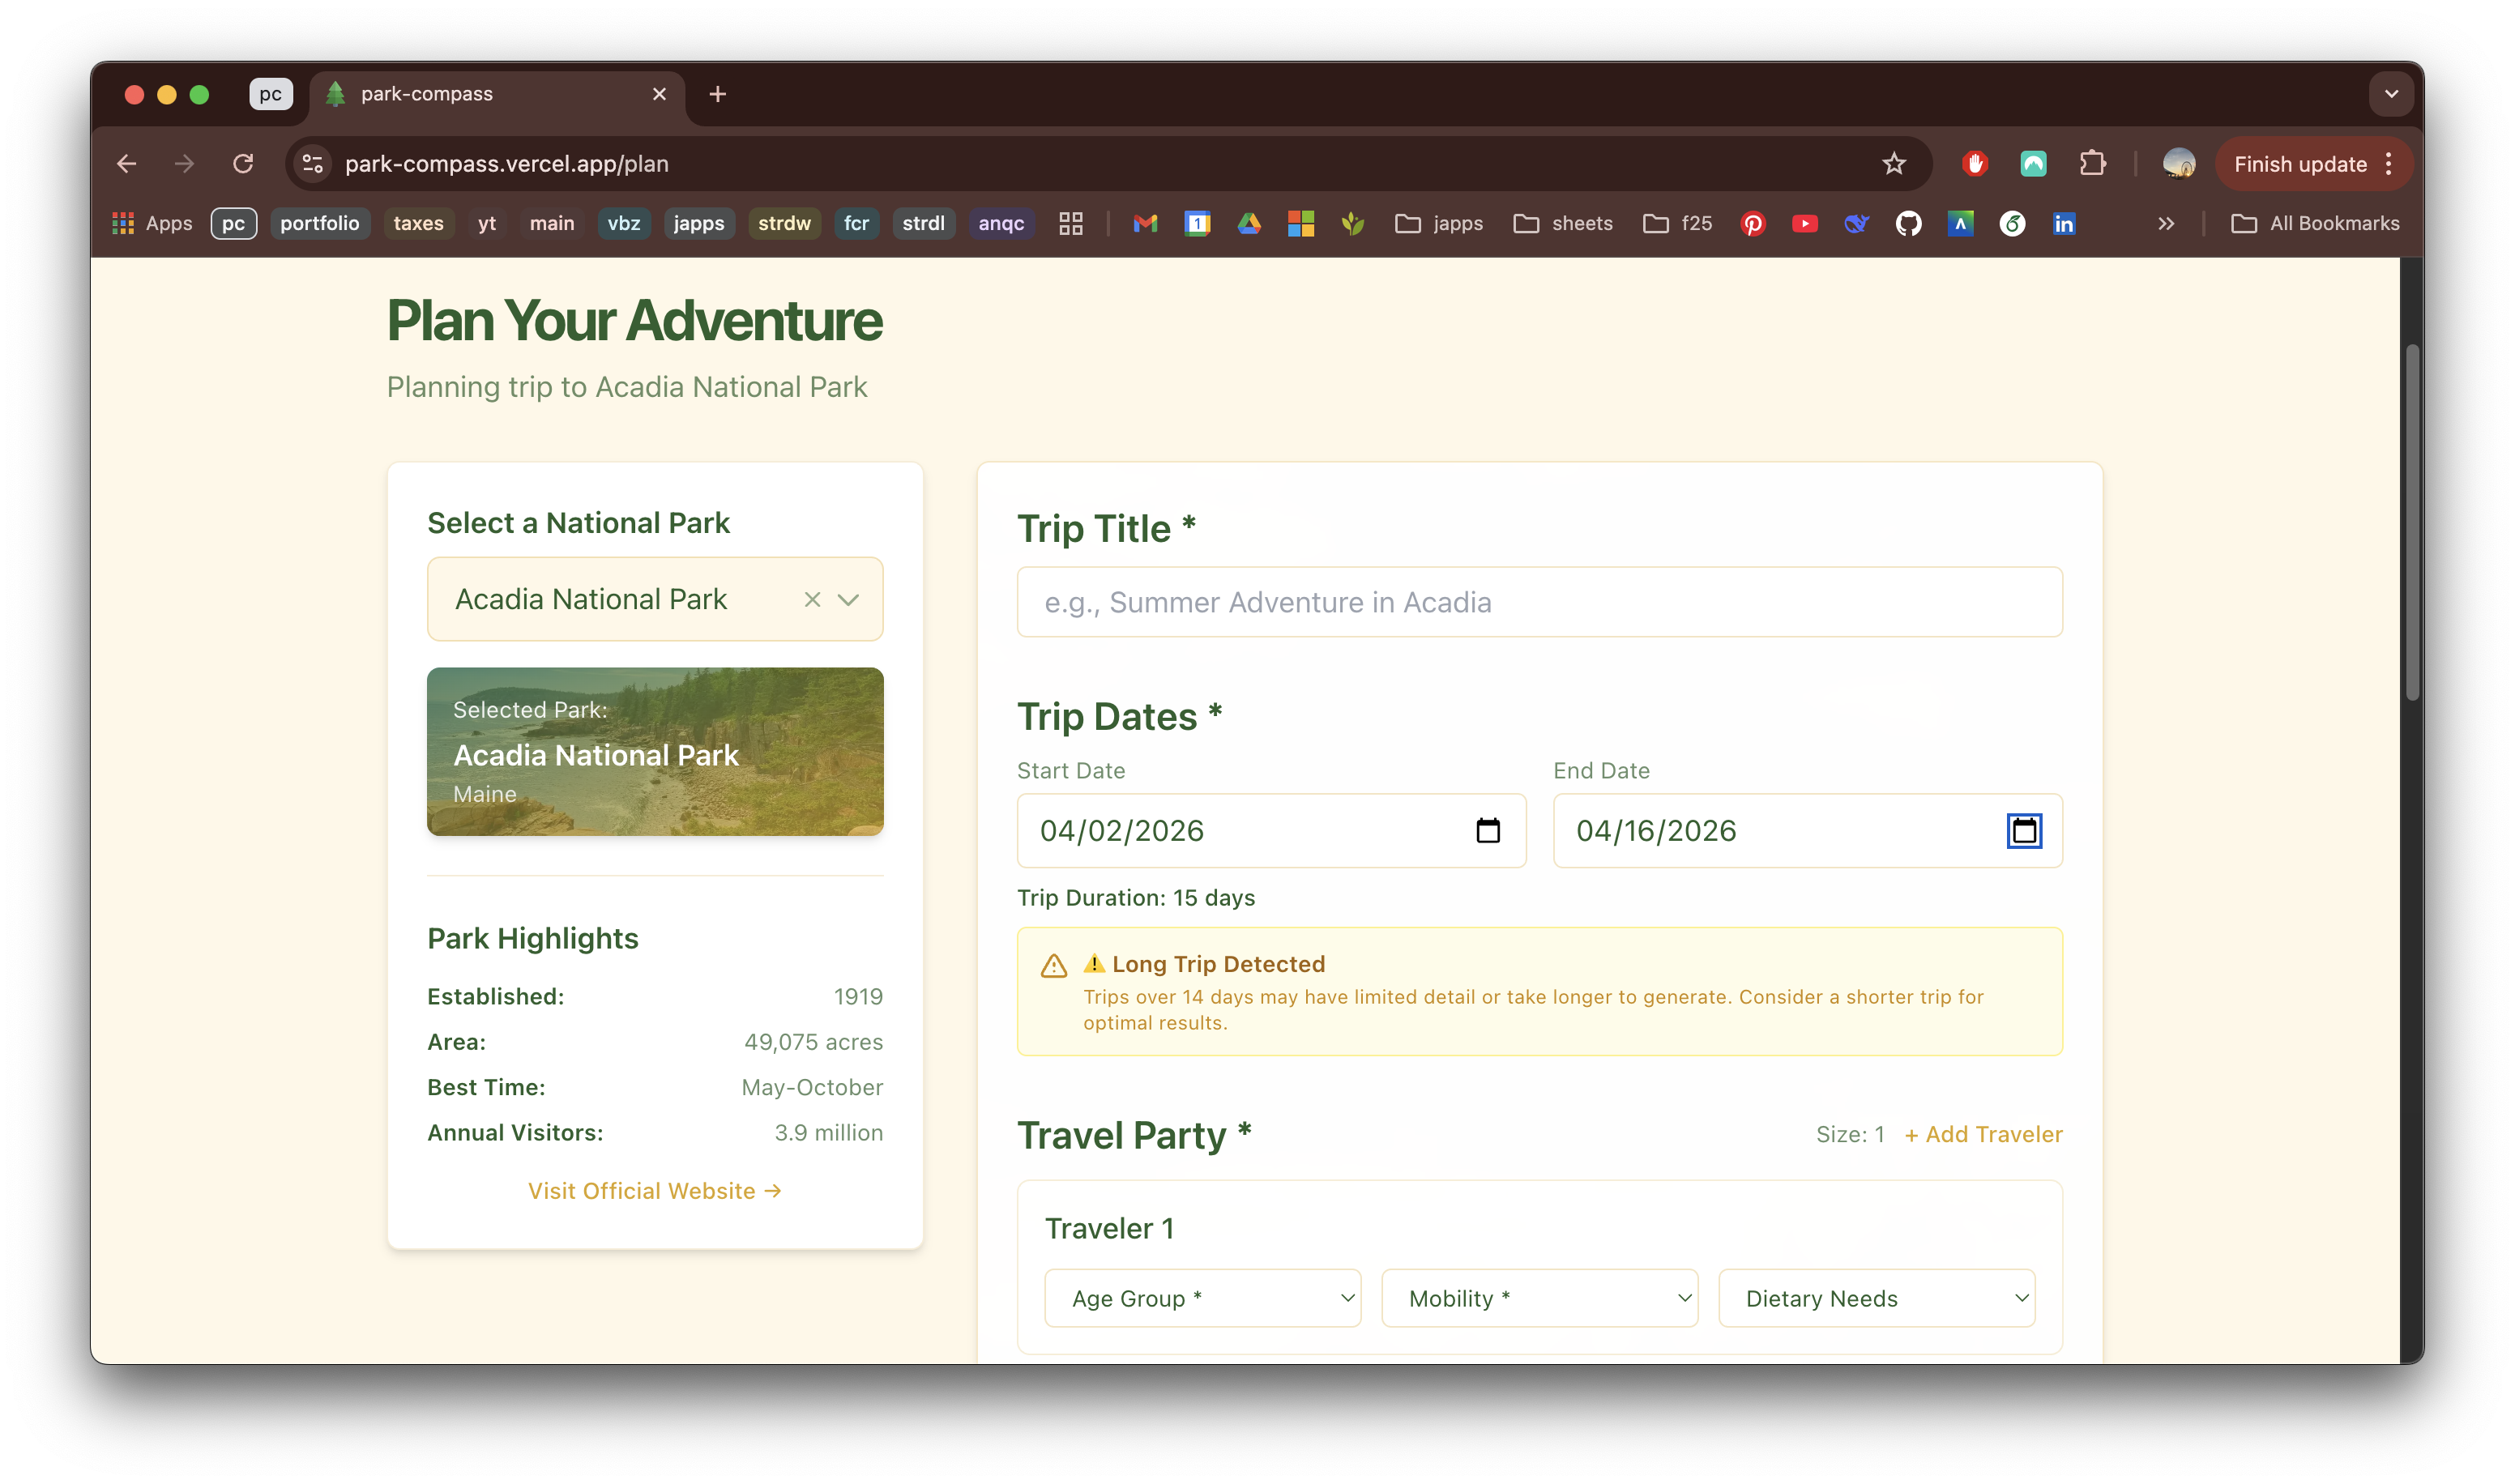
- Warning system for trips >14 days
- Fallback itineraries when truncation occurs
- Progress indicators to manage expectations
- Save reminders so you don't lose work
Next Steps
| Ongoing | Major Features | Pages | Stretch Goals |
|---|---|---|---|
|
|
|
|
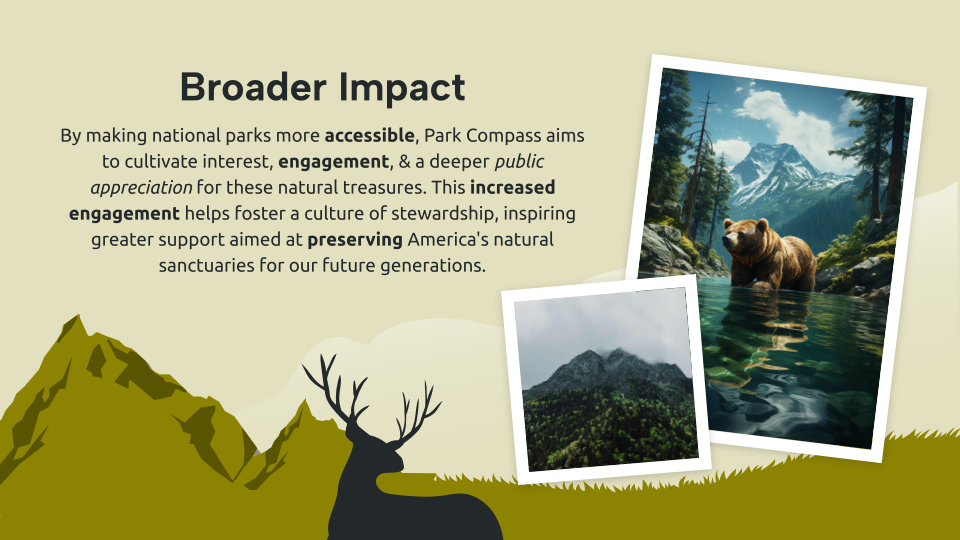
Conclusion/Broader Impact
Not only do I think this is a fun project to work on in general, but I genuinely believe this can be a meaningul tool with a broader impact. By making national parks more accessible, Park Compass aims to cultivate interest, engagement, and a deeper public appreciation for these natural treasures. This increased engagement helps foster a culture of stewardship, inspiring greater support aimed at preserving America's natural sanctuaries for our future generations. As I continue building this tool, I'll be updating the "Versions" section of this project, so be sure to check in and follow along if you too would like to use Park Compass for future trip planning!
Quantum Machine Learning for Leukemia Genomics
Fall 2025 | CS 4301 - Special Topics in CS: Fundamentals of Conducting Research
Advisor: Dr. Ovidiu Daescu
CS 4301: Course Description
The course introduced the principles of conducting research, focusing on the practical aspects of effective research facilitated by the emergence of AI technologies. The course had a lecture component and a project component. Students worked in teams to solve research problems they chose and produced research reports and software implementations of proposed solutions.
Research Project Overview
This study investigated whether Variational Quantum Classifiers (VQCs) could achieve competitive performance for classifying Acute Myeloid Leukemia (AML) vs. Acute Lymphoblastic Leukemia (ALL) while demonstrating superior parameter and feature efficiency compared to classical models. Using the seminal Golub leukemia dataset, which epitomizes the "small n, large p" challenge with 72 patients and over 7,000 genes, we benchmarked quantum models against classical Support Vector Machines (SVMs) and Multi-Layer Perceptrons (MLPs) across varying levels of data scarcity and feature set sizes.
My Role & Responsibilities
- Led the quantum model implementation in PennyLane (angle/amplitude/hybrid encoding, VQC, QSVM) and assisted with the Qiskit implementations.
- Conducted comprehensive data preprocessing and EDA on the leukemia dataset.
- Established systematic benchmarking frameworks across four of the experimental groups.
- Authored significant portions of the final report including but not limited to methodology and quantum framework/circuit architecture design.
- Conducted comprehensive literature review of hybrid quantum-classical machine learning advancements and biomedical applications, synthesizing key findings and sharing insights with the team to guide experimental design and methodology selection.
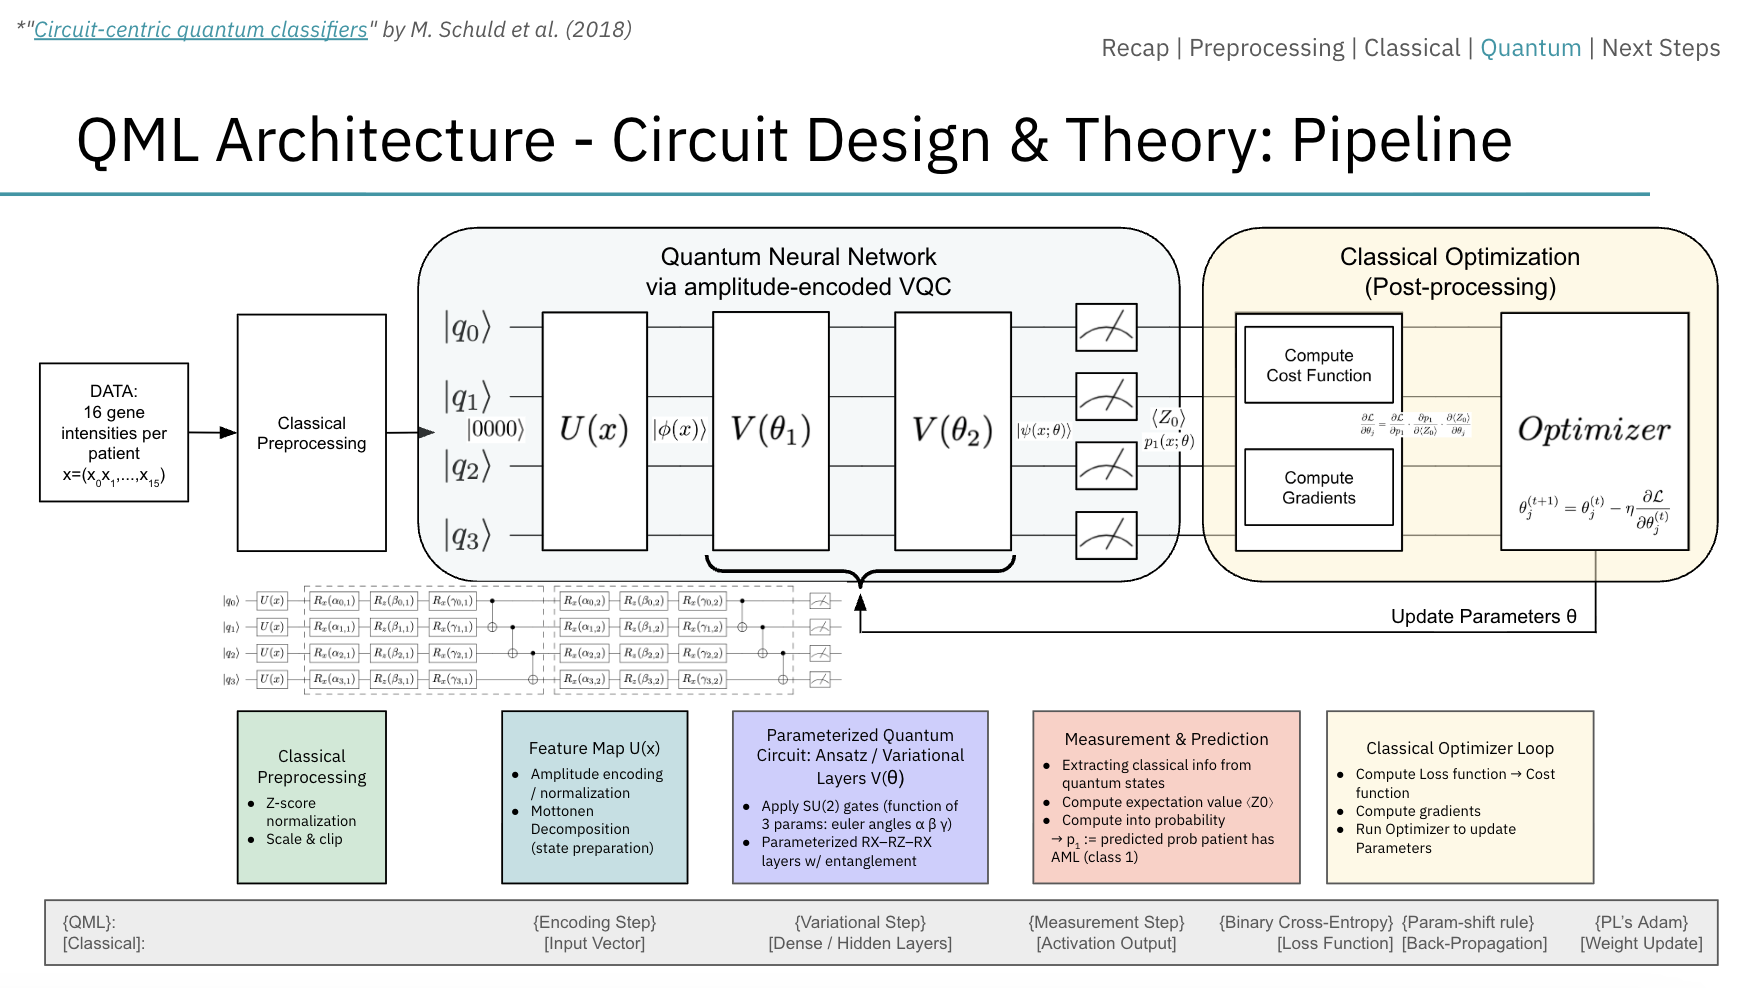
Technical Approach
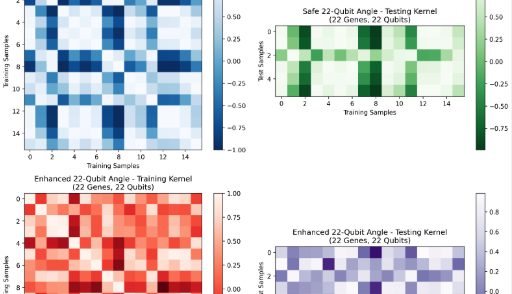
We implemented VQCs using two encoding strategies: angle encoding, where each gene feature is encoded as a rotation on a dedicated qubit, and amplitude encoding, which compresses feature vectors into the probability amplitudes of a quantum state for logarithmic qubit scaling. Models were developed using dual quantum frameworks (Xanadu's PennyLane and IBM's Qiskit) to ensure robustness. Classical baselines included standard SVMs with RBF kernels, MLPs with extensive regularization, and a SCAD-regularized SVM that performed embedded feature selection via non-convex optimization.
Challenges
- The first challenge was definitely the steep learning curve. With most of our team coming from beginner-intermediate programming backgrounds, with little to know research experience, learning how to work through a research project from start to finish was definitely a very challenging yet rewarding experience!
- The second issue we ran into once we had gotten some rudimentary models programmed, were hardware constraints. Turns out running quantum machine learning simulations on your laptop isn't very feasible. To work around this we limited the number of qubits used in our simulations, as well as using some of our university's devices to run some of the more intense experiments. If we had more time, we had begun to discuss the process of how we would transition to using our university system's HPC cluster.
- Outisde of knowledge gaps and hardware constraints, one of the actual research obstacles we ran into was that of the barren plateau phenomenon, where gradients vanish exponentially with qubit count, making optimization extremely difficult. The Quantum models also exhibited high sensitivity to architecture and hyperparameters, small increases in qubit count or layer depth caused sharp performance drops, indicating that more qubits or layers do not always improve performance and may lead to overfitting or optimization failure. For amplitude encoding, we observed persistent class imbalance issues resulting in biased predictions toward the majority ALL class, with additional debugging needed in the codebase.
Results
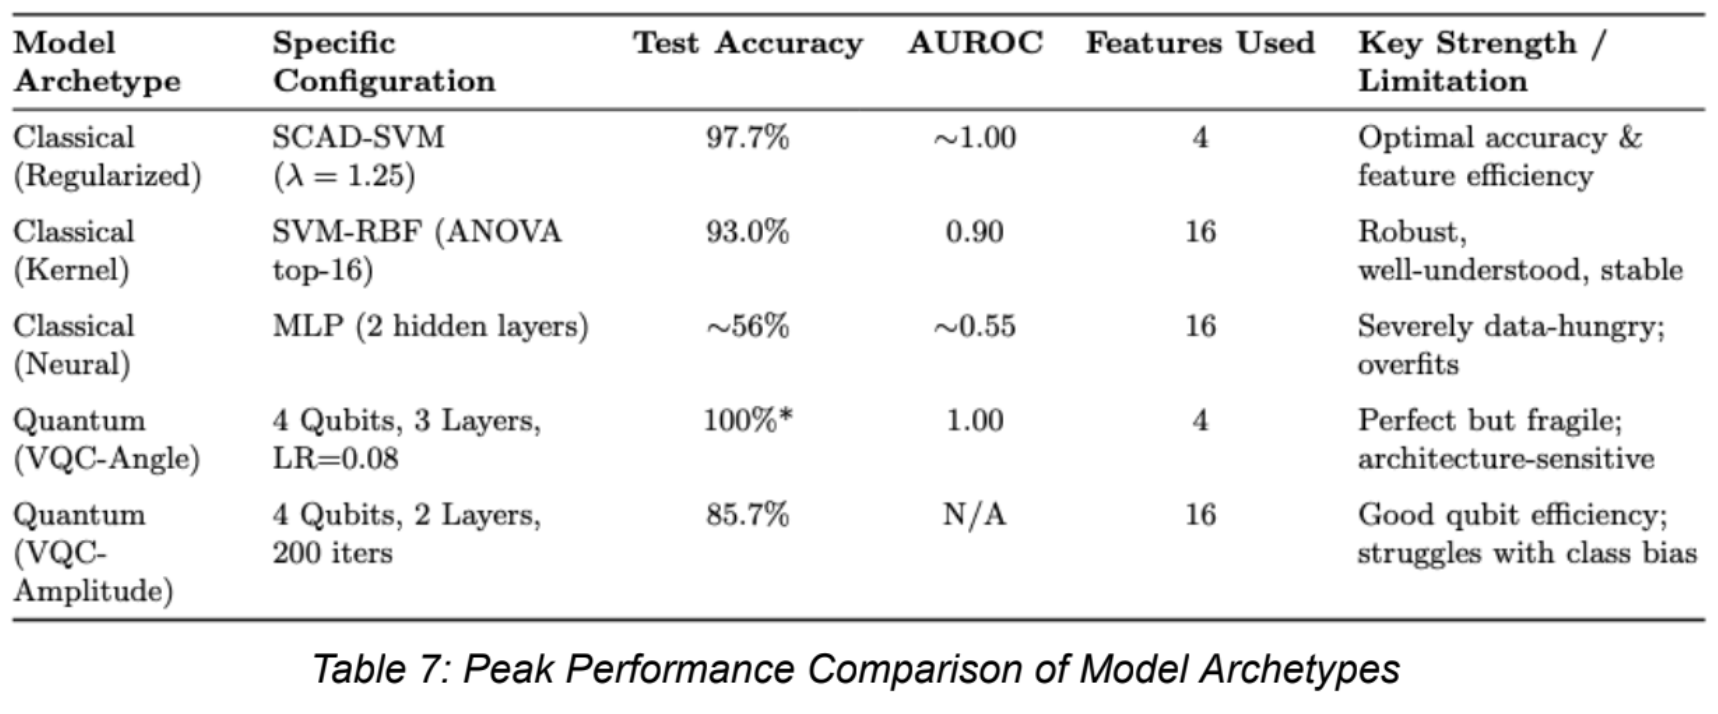
Classical Models with Proper Regularization: A SCAD-regularized SVM achieved 97.7% accuracy over 50 tests using only 4 genes, outperforming other feature selection methods (ANOVA, SNR) that required more features but delivered lower accuracy. This demonstrates that embedded feature selection via SCAD is highly effective for high-dimensional biological data. The SCAD-SVM was tuned across 10 different lambda values from 0.3 to 2.0 to identify the optimal regularization strength.
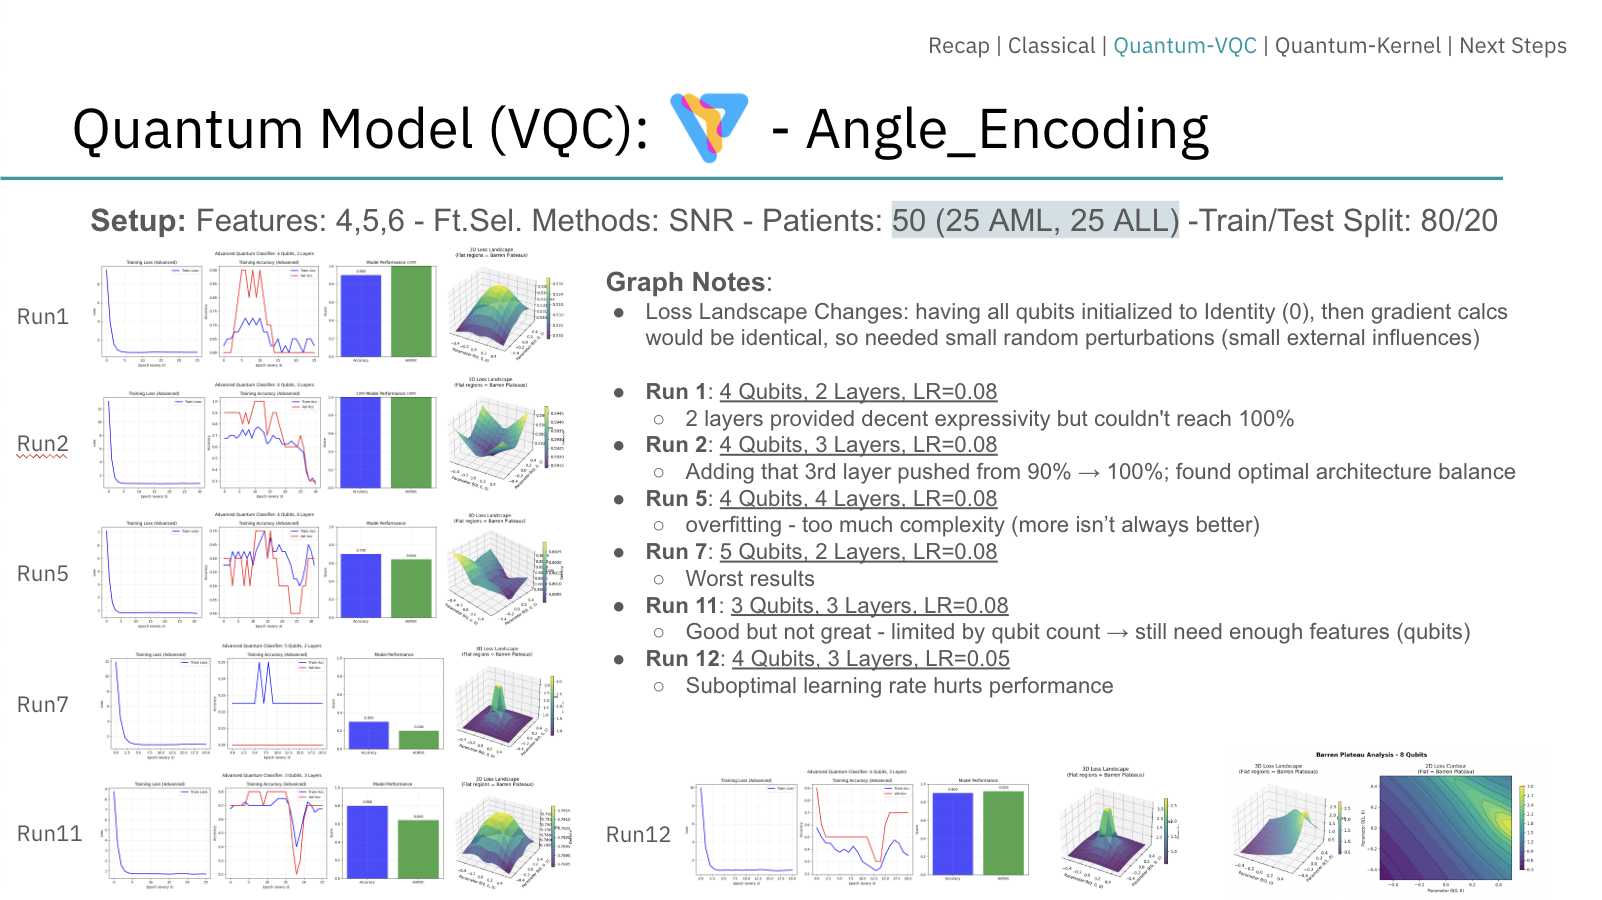
Angle-Encoded VQC: Following systematic exploration of over 240 experimental configurations (≥5 runs each), we identified an optimal setup—4 qubits, 3 layers, learning rate 0.08—that achieved 100% accuracy. This optimal configuration was discovered only after extensive hyperparameter sweeps varying qubit counts (3–16), circuit depths (2–5 layers), learning rates (0.05–0.1), and feature set sizes (8–50 SNR-selected genes). Performance proved highly fragile: deviations from this configuration, such as adding more qubits or layers, consistently degraded results, highlighting overfitting and optimization difficulties characteristic of barren plateaus. However, given the sensitivity observed and the extensive tuning required to achieve this result, further experimentation on larger and more diverse datasets is needed to establish whether such performance can be consistently reproduced.
Amplitude-Encoded VQC: Demonstrated theoretical promise by compressing 32 gene features into just 5 qubits (logarithmic scaling), though best accuracy reached only 85.7% with depth 2 and 200 iterations across 20+ architectural variations. The model struggled with class imbalance, remaining below classical performance while offering a potential pathway for scaling to larger feature sets.
Efficiency Comparison: Quantum models used less than 1% of the parameters of a comparable classical MLP (which contained over 2,500 parameters), validating their parameter efficiency advantage. However, classical models still lead in accuracy and stability, while quantum offers theoretical feature compression advantages.
Tools Used
- Classical: scikit-learn (SVM, MLP), custom SCAD regularization implementation
- Quantum: PennyLane for hardware-agnostic hybrid training, Qiskit for complementary validation
- Optimization: SPSA for noise resilience, COBYLA/Adam-optimizer for small-scale exploration, parameter-shift rule for gradient computation
- Data Processing: SNR-based gene ranking, ANOVA feature selection, Z-score normalization
Conclusion
For AML vs. ALL classification on the Golub dataset, no quantum advantage in outright accuracy was demonstrated; classical models with advanced regularization currently provide the most accurate and stable practical solution. However, quantum models show definitive promise in parameter efficiency and feature-space compression, presenting a compelling pathway for scalable learning in future higher-dimensional biomedical applications where classical scaling becomes prohibitive. The results suggest that while quantum models are more sensitive to hyperparameters and optimization challenges, their theoretical efficiency advantages warrant continued investigation. Other than that, I really enjoyed learning a lot of the knitty gritty details, getting to work on such a compelling project, and meeting new people along the way!
Risk Radar: Tweet Analysis for Disaster Crisis Response
Sep-Dec 2025 | CS 4485 - Senior Design Capstone Project
Advisor: Professor Selim Sarac
Course Overview
This course was intended to complement theory and to provide an in-depth, hands-on experience in all aspects of a software development project. Students worked in teams and were involved in specifying the problem and its solution, designing and analyzing the solution, developing the software architecture, along with implementation and testing plans. The deliverables included reports that documented these steps as well as a final project report, including the challenges they faced, and a user manual of the developed system. Students explored security issues of their project and its potential impact on society. Teams also made presentations and demonstrated their final software. Additionally, this course covered topics related to computer science professions including ethics and professional responsibility, entrepreneurship, leadership, and project management.
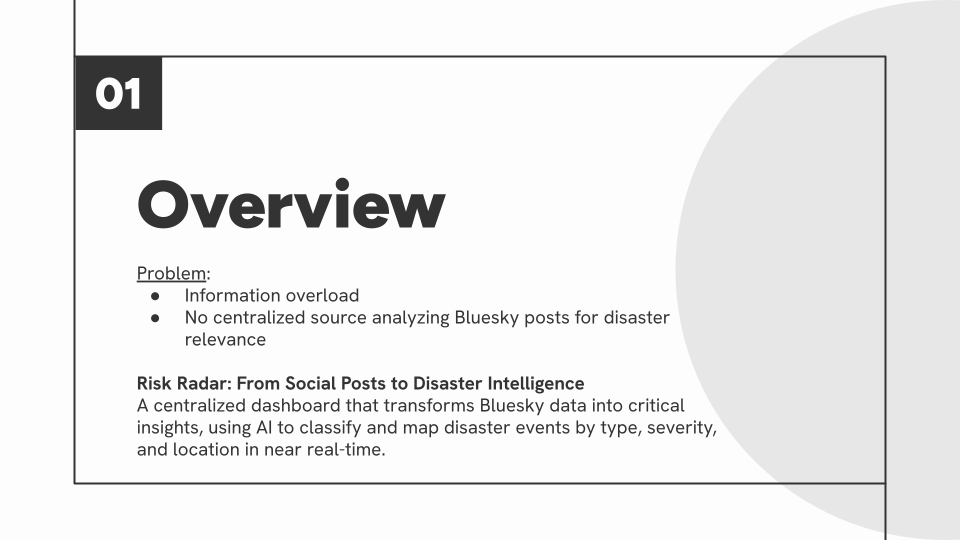
Project Overview
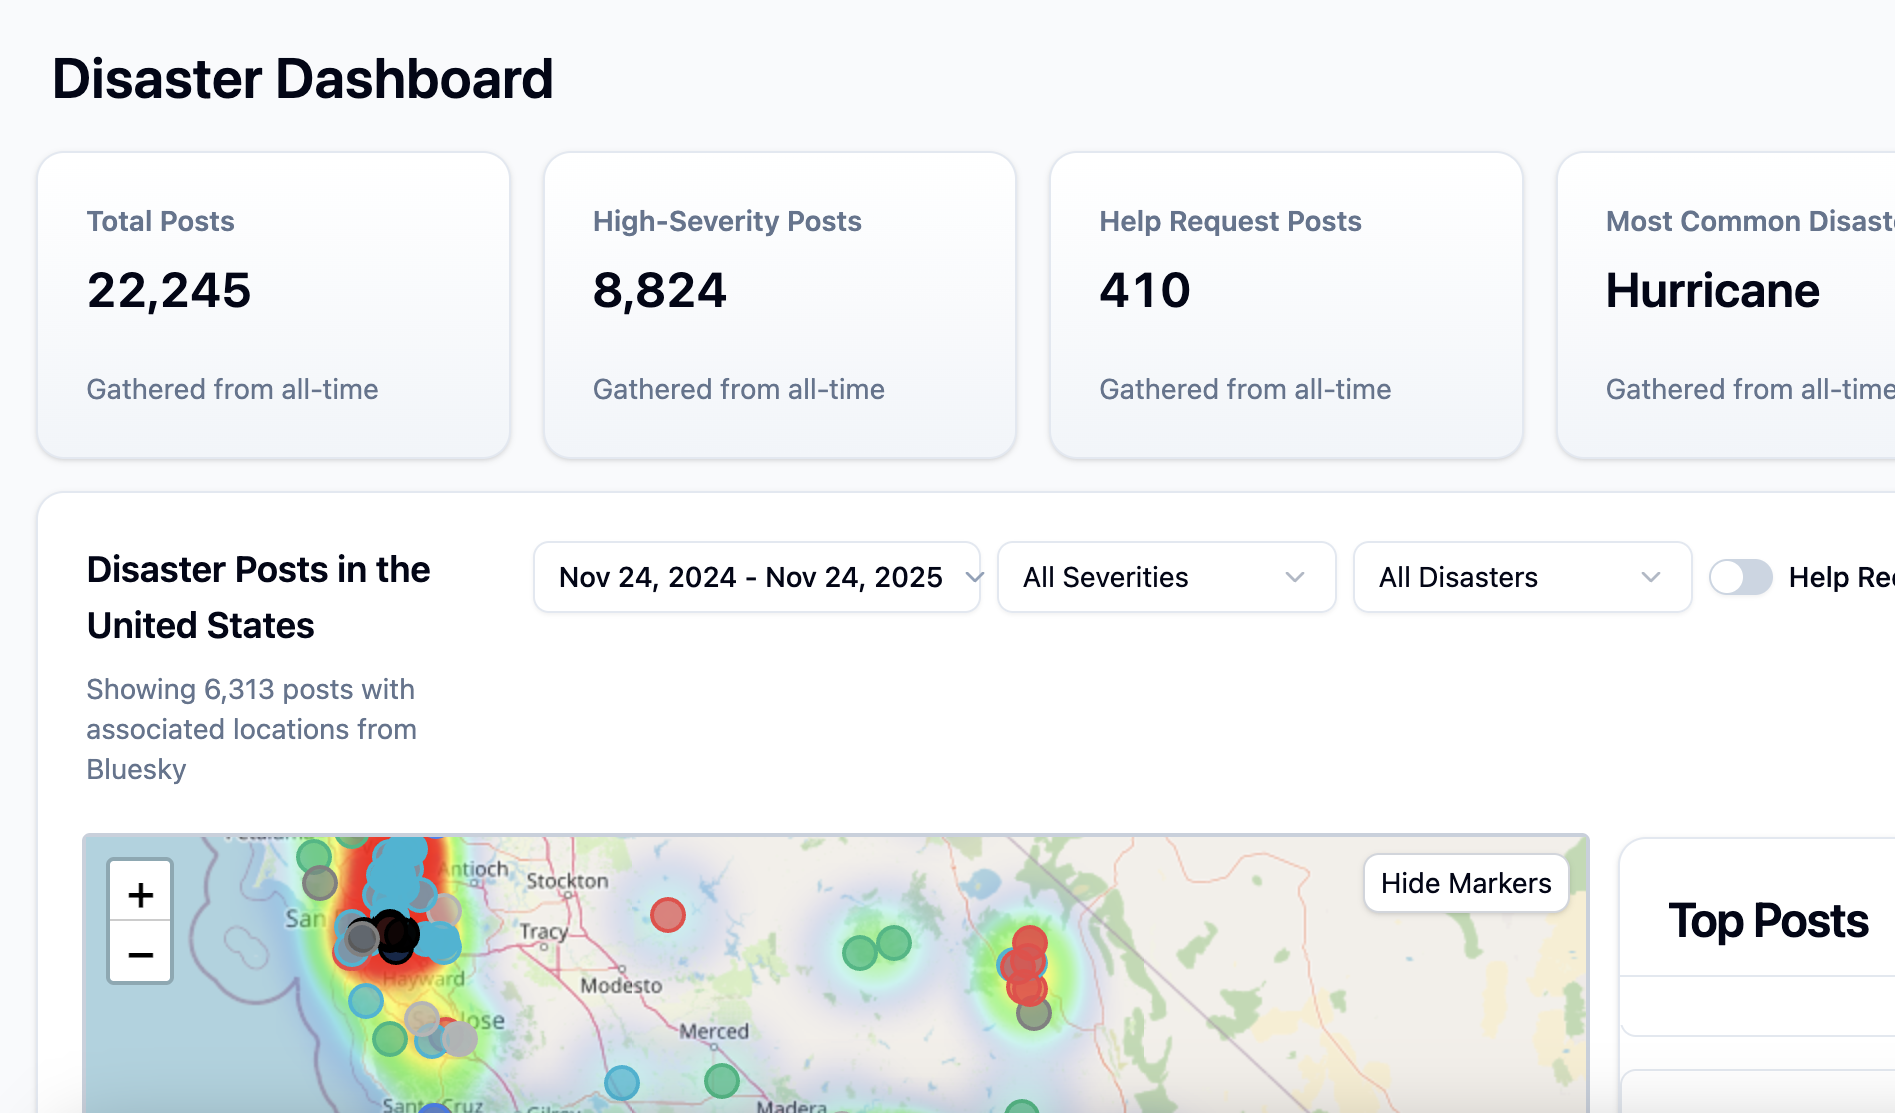
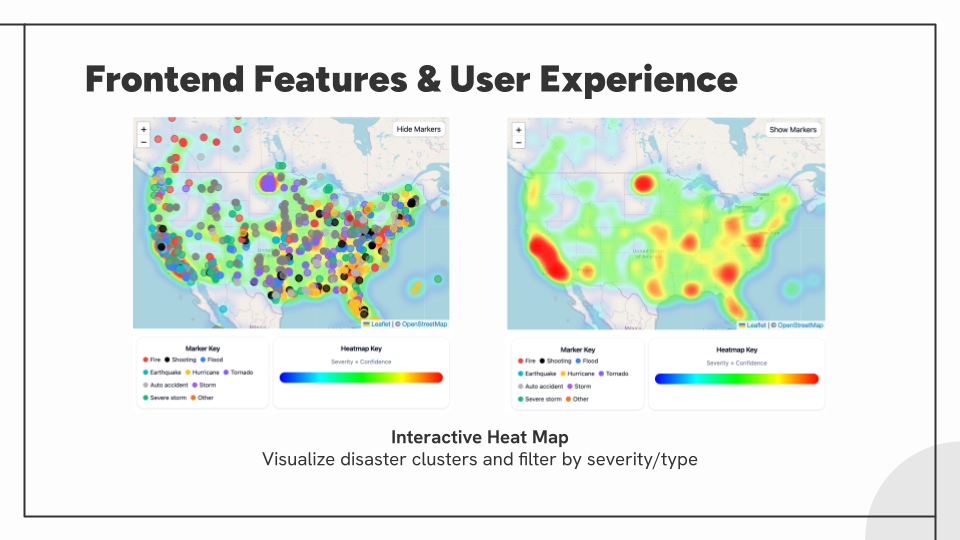
Risk Radar is a centralized crisis detection dashboard that transforms real-time social media data from Bluesky into actionable disaster intelligence for emergency responders and the public. The system uses a Large Language Model to automatically classify posts by disaster type, severity, location, and help requests, presenting this information through an interactive geospatial interface.

My Role and Responsibilities
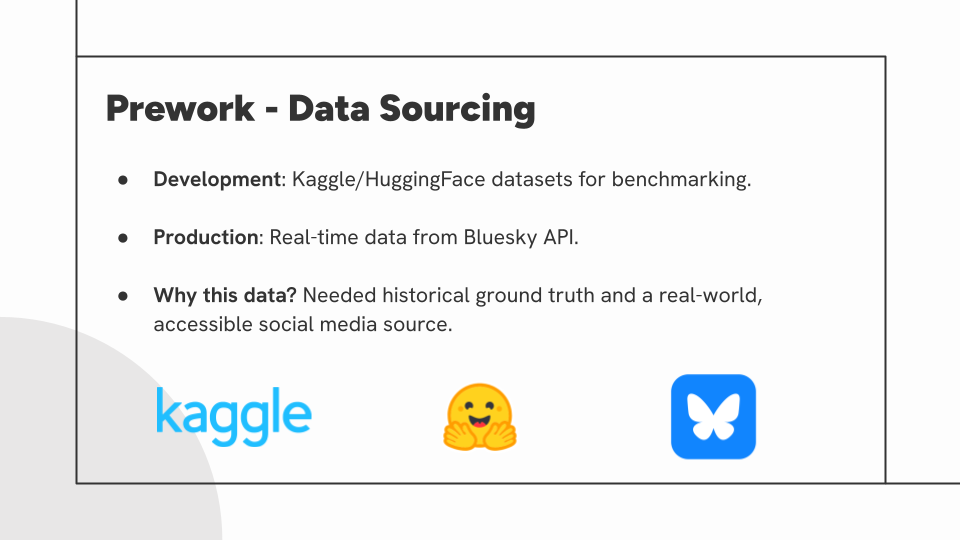
As the Data Science Lead, I was responsible for the complete model development lifecycle:
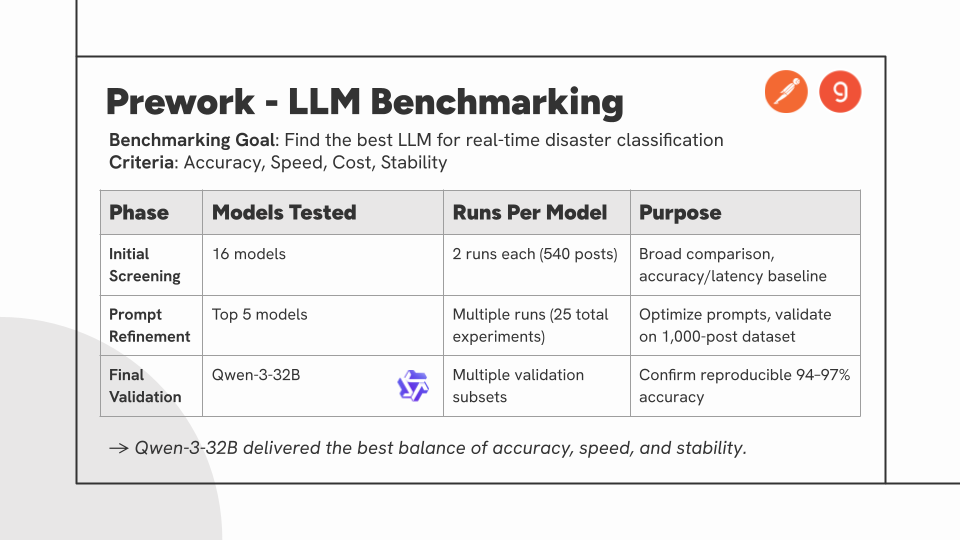
- Dataset Curation: Assembled and labeled benchmarking datasets, including a balanced 540-post set for initial evaluation and a 1,000-post real-world distribution for validation, sourcing from Hugging Face, Kaggle, and CrisisNLP.
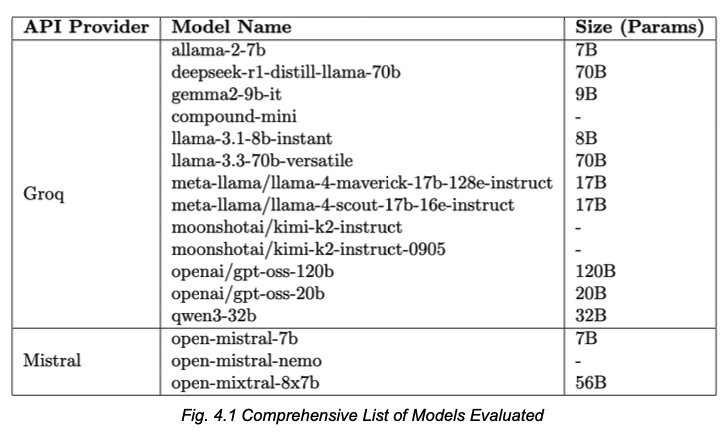
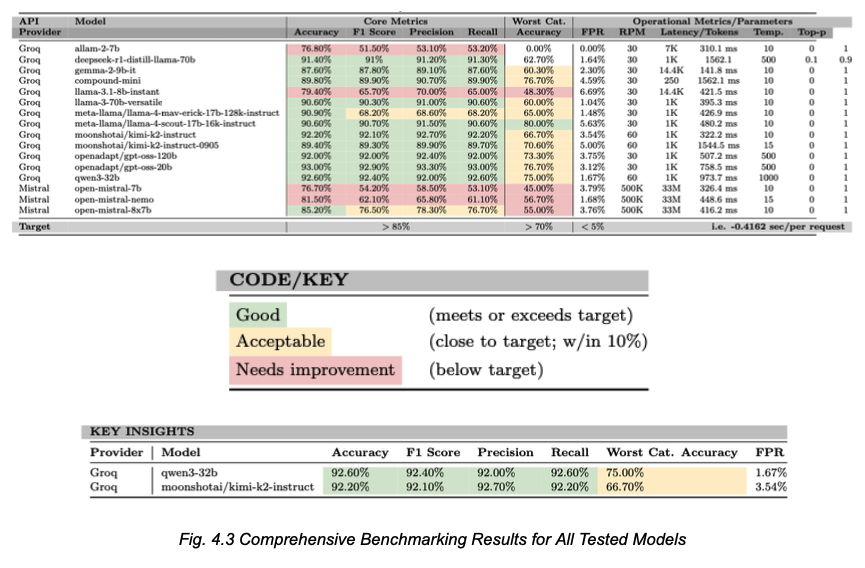
- Model Benchmarking: Evaluated 16 different LLMs across multiple architectural families through systematic testing using Postman automation.
- Model Selection: Led the analysis that identified Qwen3-32B as the optimal model, achieving 94-97% reproducible accuracy with balanced performance and reliability.
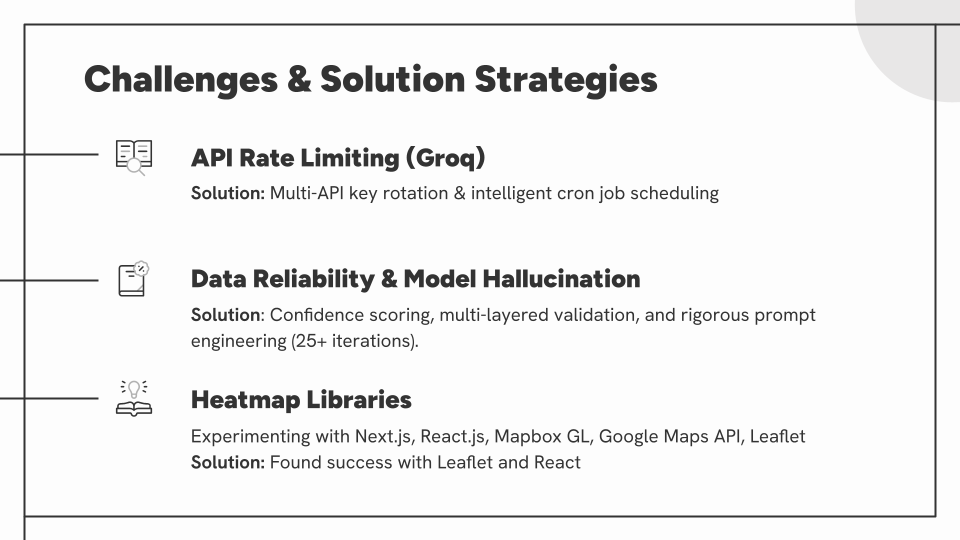
- Prompt Engineering: Conducted 25 iterative refinements to optimize classification logic for disaster taxonomy, severity assessment, and location extraction.
- Production Integration: Collaborated with backend team to implement Supabase Edge Functions that interface with the Groq API, incorporating rate limiting and error handling strategies.
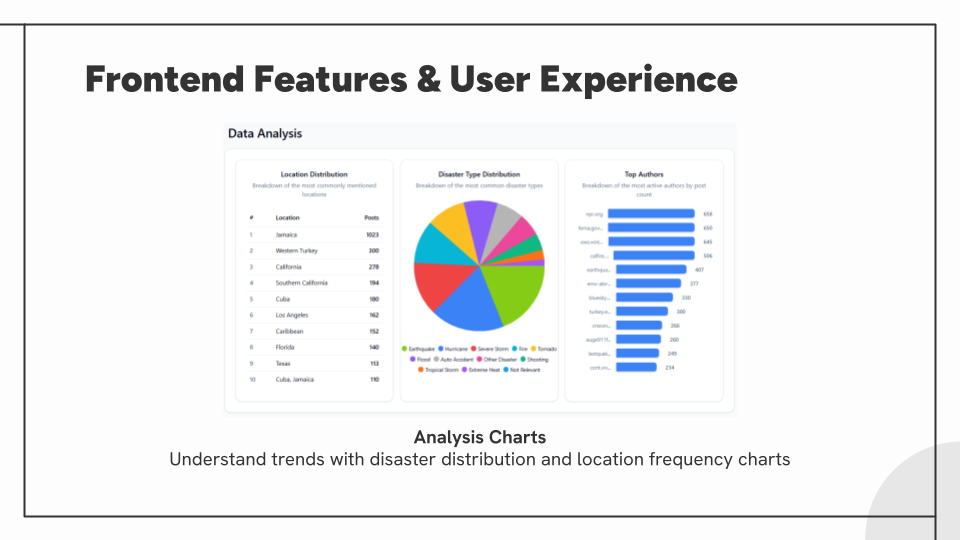
- Frontend Data Visualization: Assisted the frontend team in implementing analytics charts and graphs, and translating structured model outputs into intuitive visual representations of disaster distributions and trends for the dashboard.
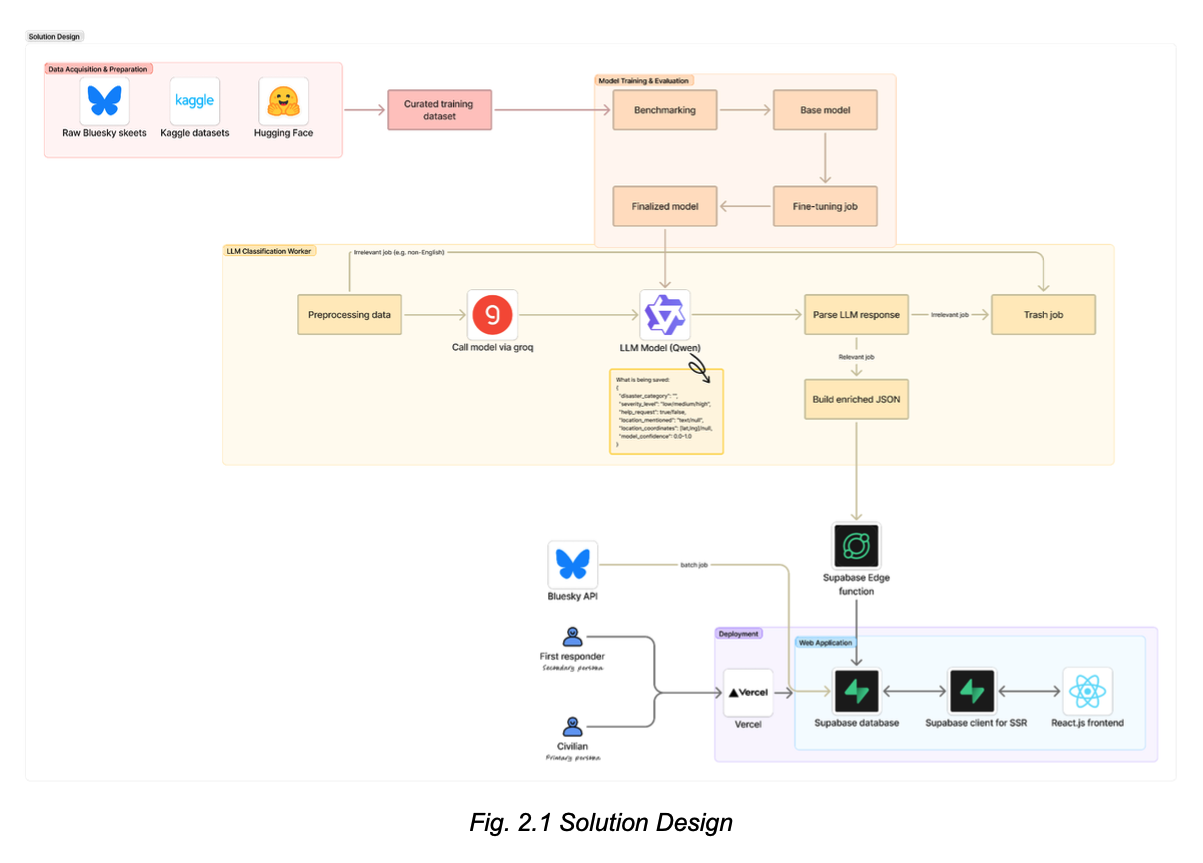
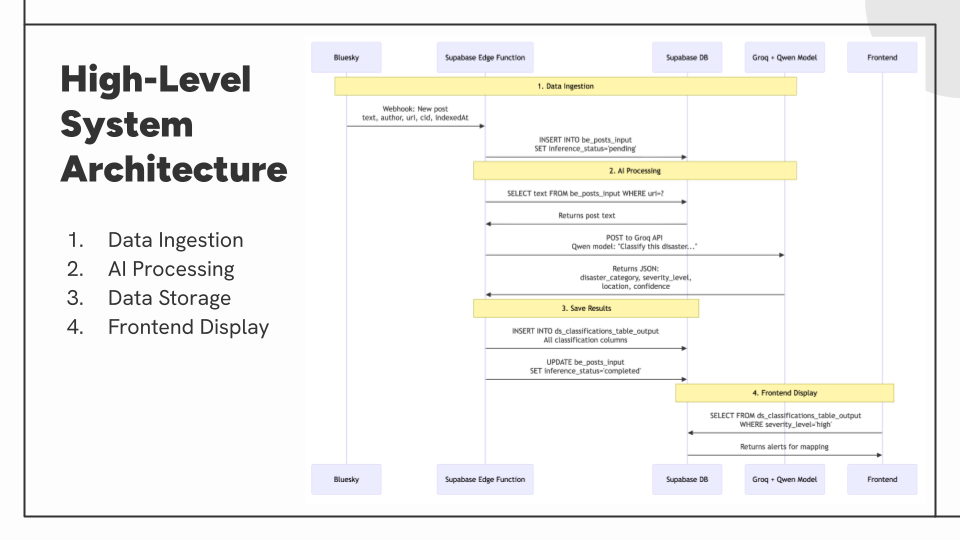
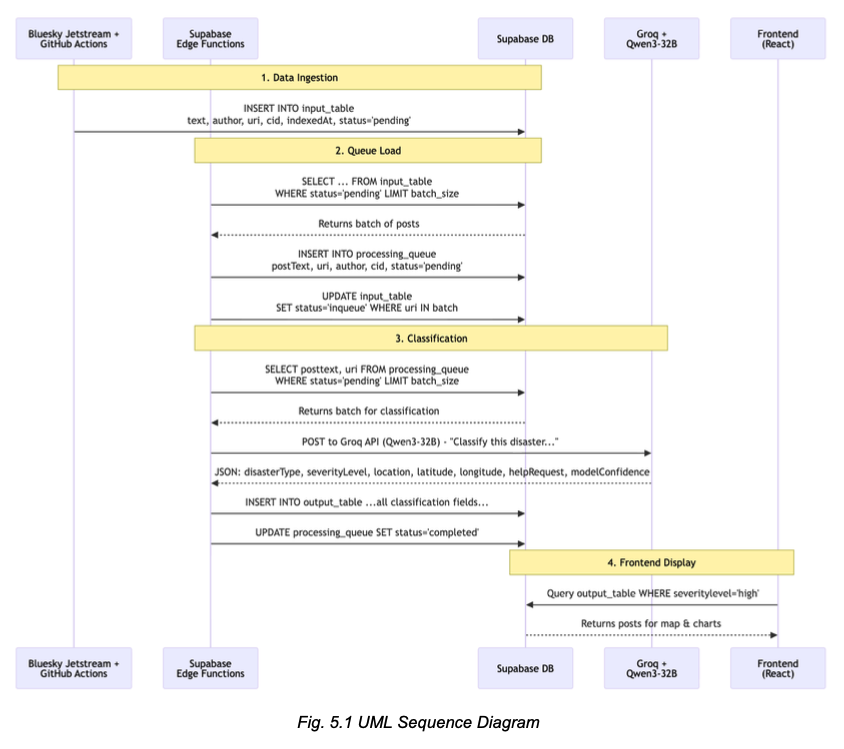
Key Component: Data Pipeline
- Ingests live Bluesky posts via Jetstream firehose with keyword/language filtering.
- Processes posts in scheduled batches using Supabase Edge Functions.
- Classifies content using Qwen3-32B model via Groq API
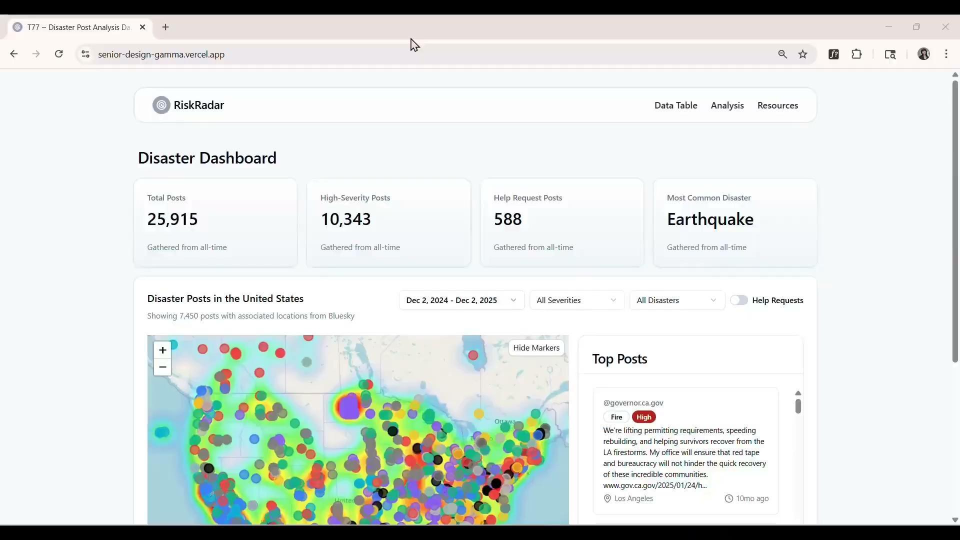
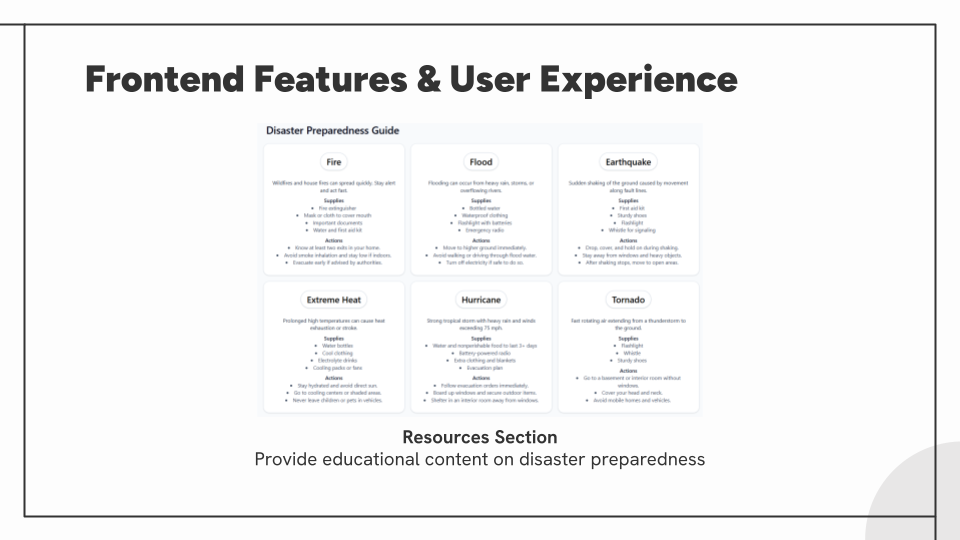
Key Component: Dashboard Features
- Interactive heatmap with color-coded disaster markers and severity indicators.
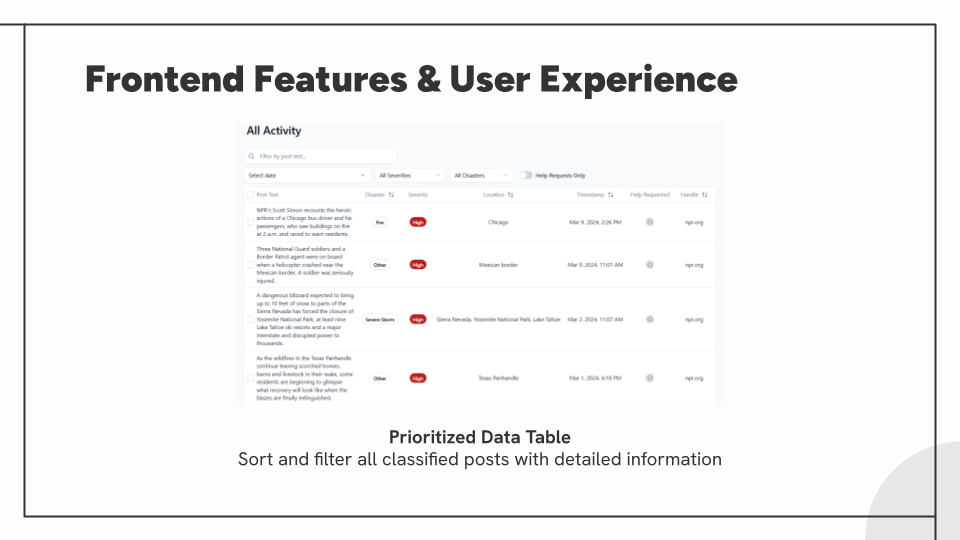
- Sortable data table with multi-field filtering (disaster type, severity, date, help requests).
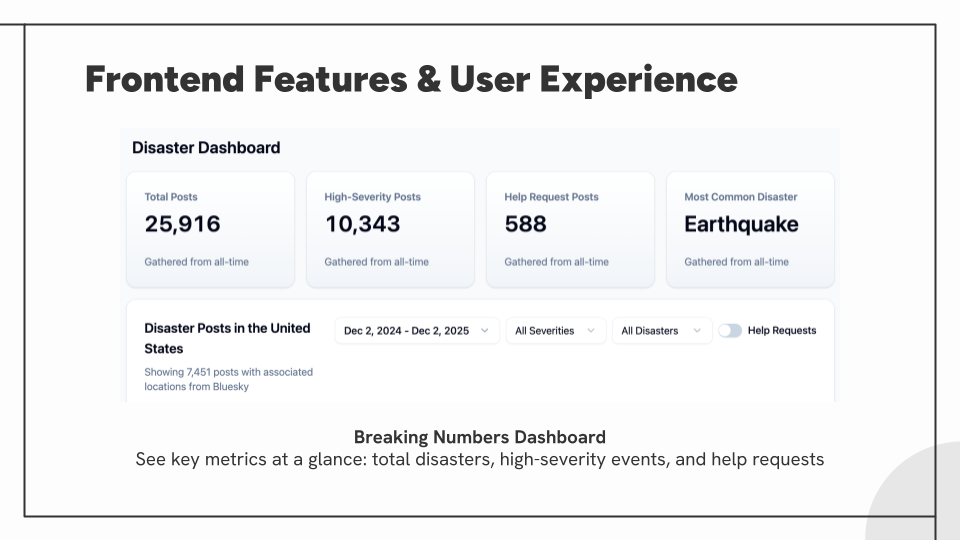
- Real-time statistics and analytics charts showing disaster distribution and trends.
- Resource page with FEMA-sourced preparedness information.
Tools Used
Development & Collaboration
- Project Management: Jira (Agile/Scrum with weekly sprints), GitHub.
- Communication: Weekly team meetings, subteam syncs, faculty advisor check-ins.
Data Science & ML
- Model Testing: Postman with automated collections, custom pre-request scripts.
- LLM Platforms: GroqCloud (primary), Mistral AI (comparative testing).
- Models Evaluated: Qwen series, OpenAI GPT family, Gemini family, DeepSeek, MoonshotAI, Llama, Mistral (16 total).
- Analysis: Python for metrics calculation (accuracy, F1, precision, recall).
Backend & Infrastructure
- Platform: Supabase (PostgreSQL, Edge Functions, REST API, authentication).
- APIs: Groq API, AT Protocol, Jetstream data service.
- Scheduling: GitHub Actions, Supabase cron jobs.
Frontend
- Framework: React.js with Vite.
- Leaflet/Mapbox (maps), Recharts/Shadcn (graphs).
- Styling: Tailwind CSS, Shadcn UI, Lucide Icons.
- Deployment: Vercel.
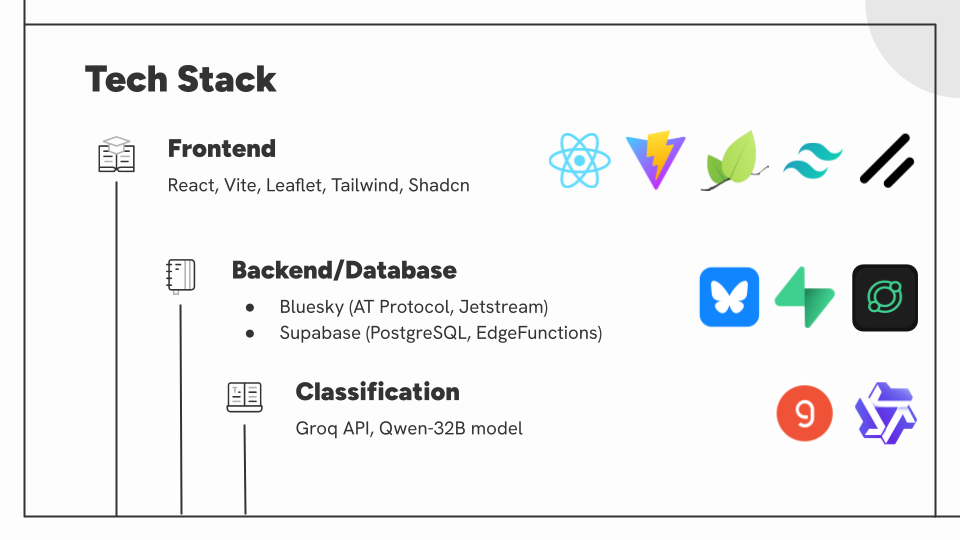
Tech Stack Summary
- Frontend: React.js, Vite, Leaflet, Shadcn UI, Tailwind CSS
- Backend: Supabase (PostgreSQL, Edge Functions), GroqCloud
- APIs: Bluesky AT Protocol, Jetstream, Groq Inference API
- Infrastructure: Vercel, GitHub Actions

Results
Operational Performance (12-day period)
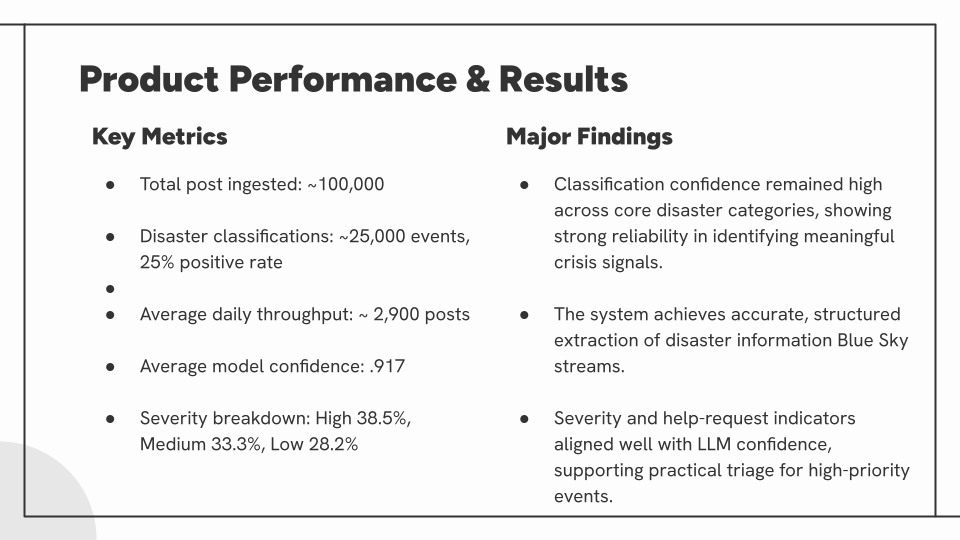
- 50,000+ Bluesky posts processed
- 10,372 disaster-related events classified (29.3% positive rate)
- 2,900 posts/day average throughput
- 0.917 average model confidence score
- < 1% final failure rate after optimization
Classification Performance
- 94-97% accuracy on validation subsets with optimized prompts
- 12-category disaster taxonomy with balanced severity distribution:
- High severity: 38.5%
- Medium severity: 33.3%
- Low severity: 28.2%
- 75+ distinct geographic locations identified
Conclusion
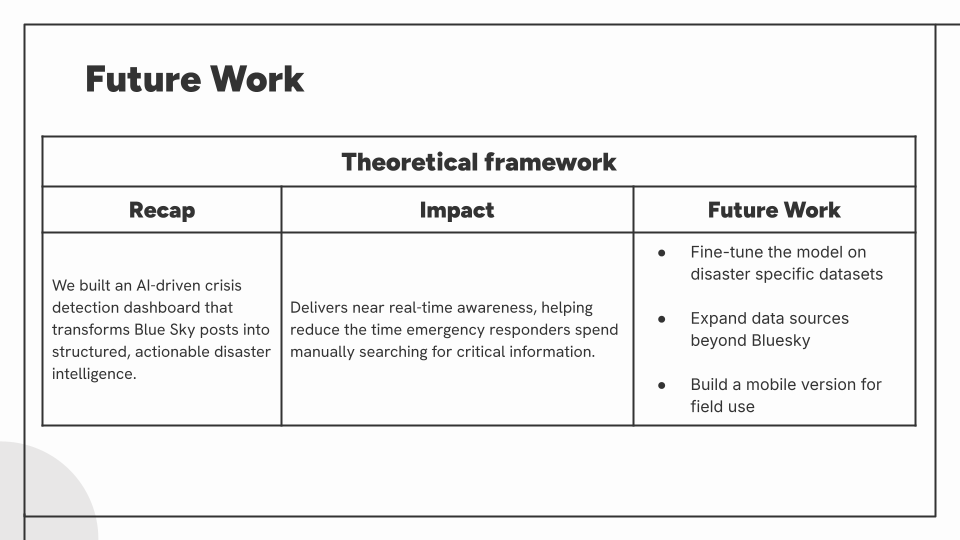
Risk Radar successfully demonstrates that purpose-built AI classification integrated with modern serverless architecture can transform chaotic social media streams into structured, actionable disaster intelligence. The system processes thousands of posts daily with high accuracy, providing emergency responders and the public with near real-time situational awareness through an intuitive geospatial dashboard.
Key achievements include the rigorous model benchmarking process that identified Qwen3-32B as the optimal model through evaluation of 16 alternatives, the development of a resilient pipeline that overcame significant rate limiting challenges, and the creation of a user-centered interface validated through iterative prototyping. The project validates that accessible cloud services and open-source LLMs can deliver enterprise-grade crisis detection capabilities without prohibitive infrastructure costs.
Future work could expand data sources beyond Bluesky, implement fine-tuning for further accuracy improvements, and incorporate image classification for multimodal disaster detection. Risk Radar establishes a strong foundation for automated crisis awareness systems that can save lives through faster, more accessible information during emergencies.
L3 Rocket - Simulation Lead; Spaceport America Cup
Jan-Jun 2024 | UTD AIAA Chapter - Competition Rocketry Team
'24 Rocketry President: Logan Murray | '24 Chief Engineer: Gabe Butuc
Tripoli Mentor: Ken Overton
Overview
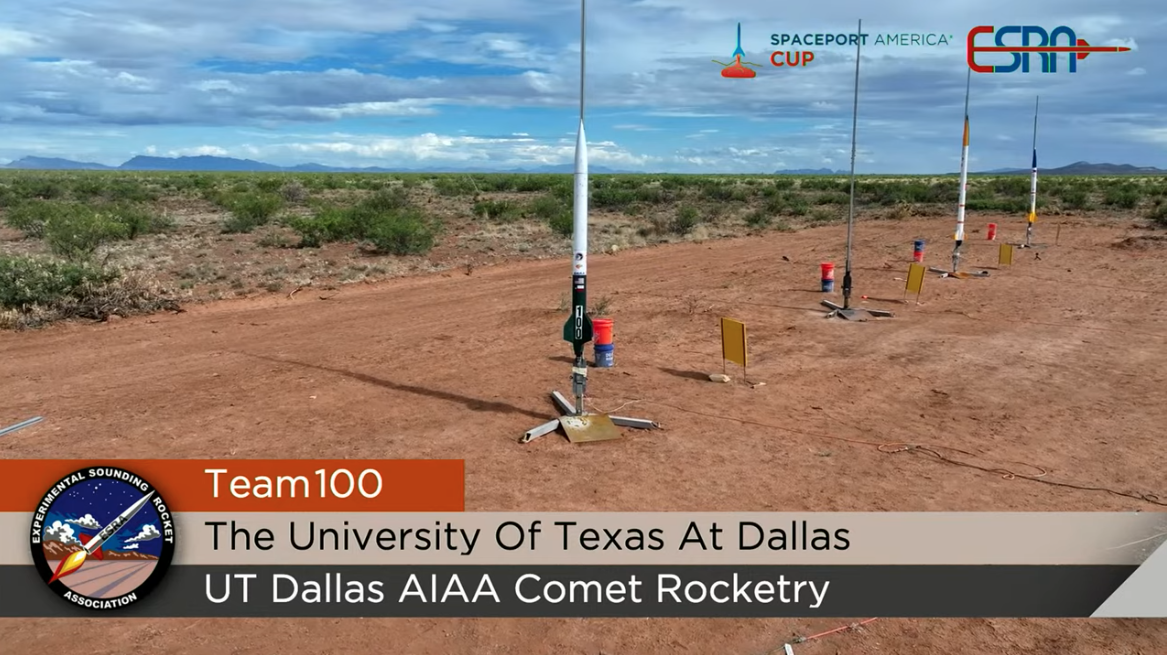
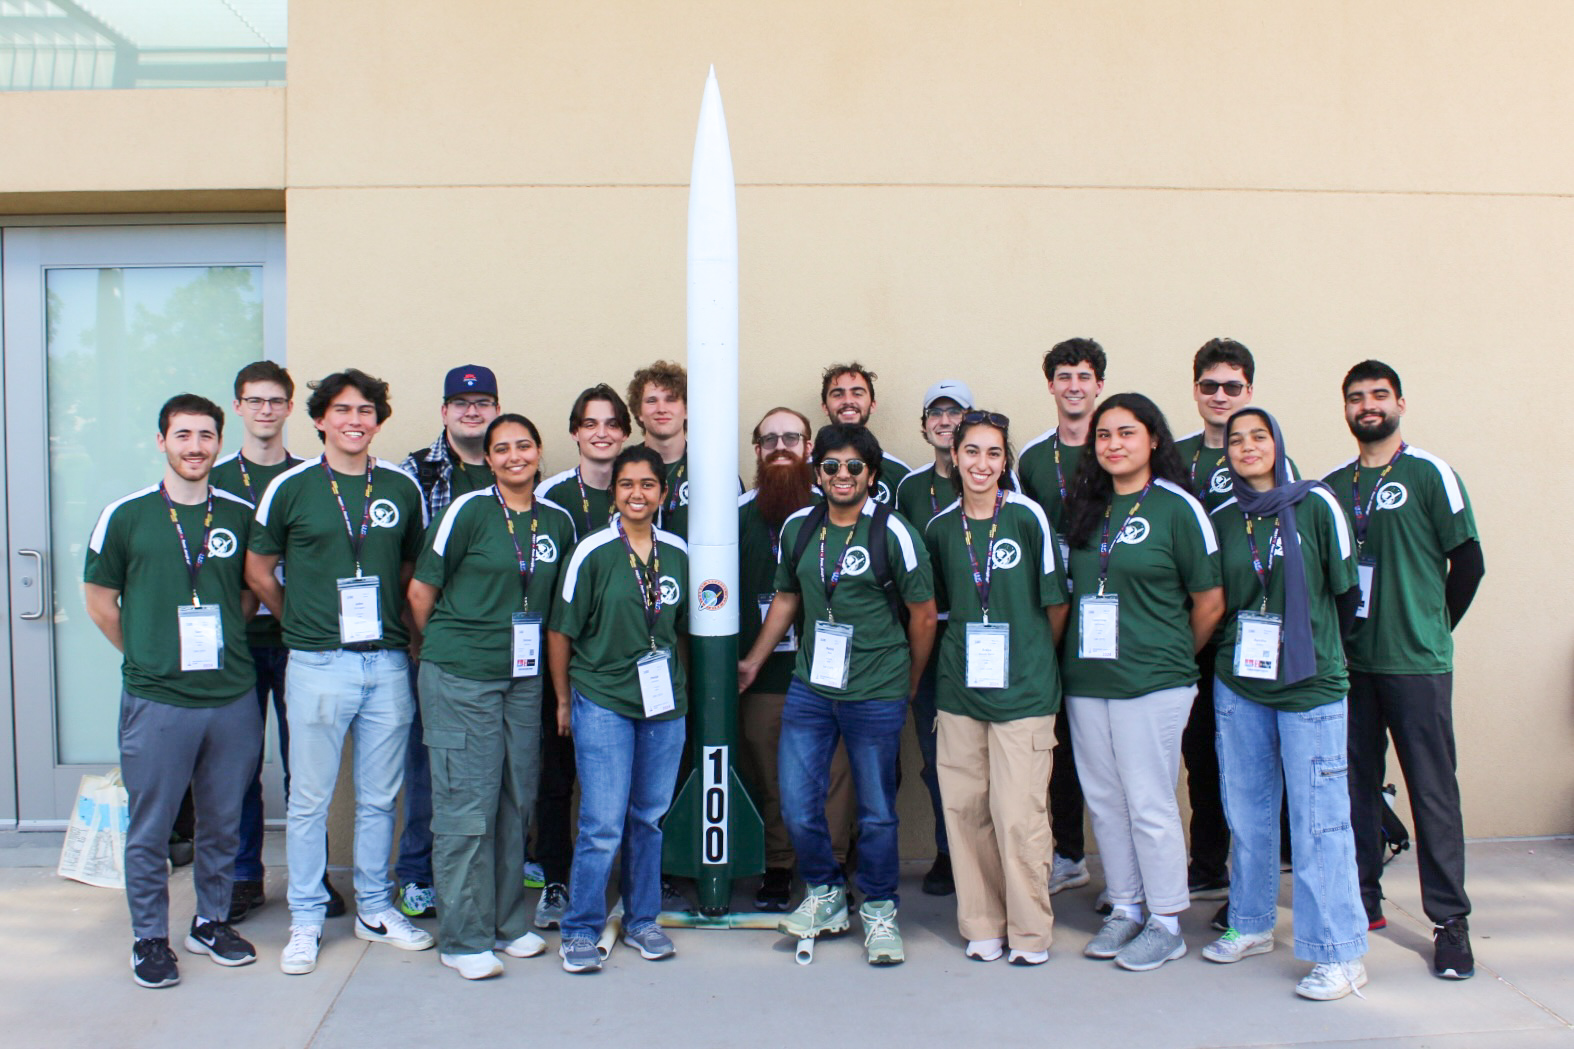
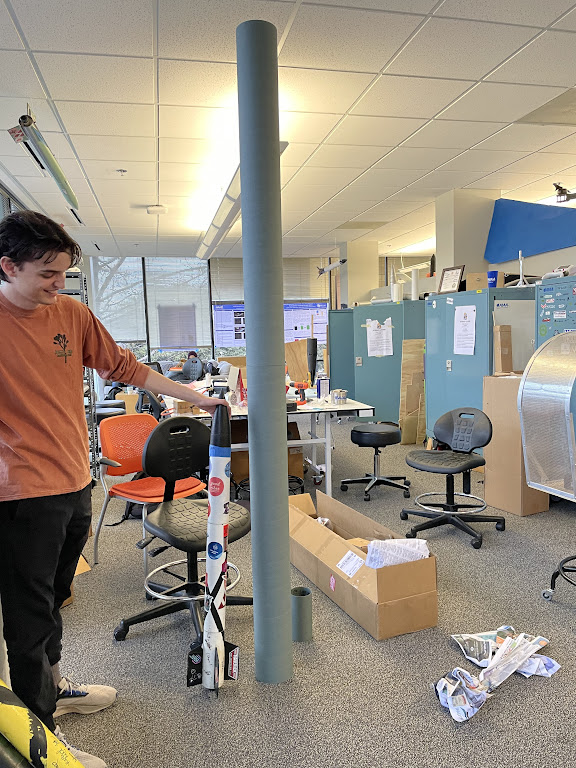
In the Summer of 2024 our university's American Institute of Aeronautics & Astronautics (AIAA) Competition Rocketry Team competed at the International Rocket Engineering Competition (IREC) at Spaceport America in Sierra County, New Mexico. This competition is the world's largest international rocketry engineering conference, hosted annually by the Experimental Sounding Rocket Association (ESRA), with over 1,700 students and faculty attending from more than 150 institutions globally. After 2 years of preparation, our team finally competed for the first time that summer in the 10K COTS competition, successfully launching and safely recovering our L3 rocket at near-target altitudes, ultimately achieving mission success.
My Role & Responsibilities
As the team's first simulation lead, my primary role was to set a precedent for how the Simulations subteam would operate. I established scope and what tools and frameworks best fit our use-case alongside our chief engineer Gabe Butuc. With no prior documentation to lean on, myself and two other simulations members spent months, researching, testing, collaborating with the other subteams, and discussing with our mentor Ken Overton, the best way to go about the task at hand.
Design Phase
The summer before competition, our team began work on an L2 rocket, named Eclipse, to prepare for the eventual L3 build. This period served as the primary design phase for both rockets, where we established the build approach, selected materials, finalized the bill of materials (BOM), and decided on the technologies to be used throughout the entire process. We test-launched Eclipse a couple of times to understand how the recovery process would work and to practice the full launch workflow before tackling the more complex L3 vehicle.
At the time, we operated with five subteams, which we eventually expanded to six. The Structures subteam was responsible for fabricating the main airframe and nose cone, manufacturing components like bulkheads and centering rings, and handling final assembly and integration. The Avionics subteam managed all internal electronics, including the design and assembly of our student-researched and developed (SRAD) flight computer, as well as parachute deployment timing and e-match circuitry. The Ground Station subteam developed the systems for remote telemetry and real-time data reception during flight. The Payload subteam focused on the experiment carried aboard the rocket, handling everything from battery retention and electronics board layout to coding an MVP for beacon ranging. The Simulations subteam was responsible for modeling our rockets using software like RocketPy, RasAero, and Ansys to predict performance and verify stability. Then we later developed a Propulsion subteam, tasked with designing and building our own rocket motors so that our team could eventually compete in challenge tracks beyond those using commercial-off-the-shelf (COTS) motors.
Throughout this phase, we also had to complete several milestones required for the IREC competition, including initial proposals, technical reports, safety reviews, and regular checkpoint reports to document our progress.
Flight Simulations
We evaluated several different simulation software frameworks, but ultimately chose to use RocketPy due to its easily accessible documentation and active open-source community. We supplemented this with RasAero for cross-verification and OpenRocket for rapid initial design iterations. To keep our work organized and collaborative, we used Google Colab and Git for version control, allowing team members to easily contribute and track changes.
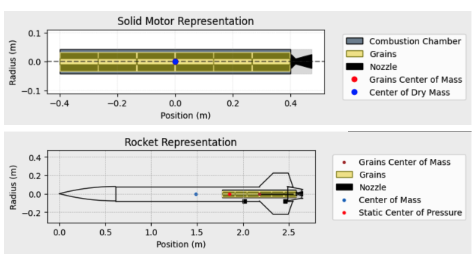
We began by modeling our L2 test rocket, Eclipse (aka: ETR), and comparing the simulation results against our actual test flight data to validate our approach. This process helped us refine our inputs and better understand how each software handled variables like surface finish and atmospheric conditions. It also required extensive research into which motor we would use, involving frequent discussions with the Structures team to ensure compatibility, and ultimately meant we learned how to model and simulate a motor inside and out, as accurate performance data was essential to our simulations. We repeated the same process with an L1 rocket to further cross-reference our methods. This served a dual purpose: it helped bridge the gap for potential future competition team members who were, at the time, participating in our other rocketry program where students learn to build, launch, and certify their own L1 rockets.
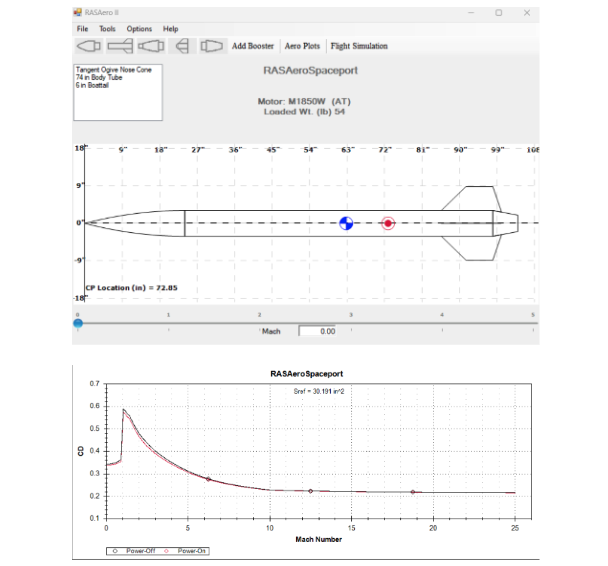
For Eclipse, we ran simulations across all three platforms. OpenRocket predicted an apogee of 5,594 feet, while RocketPy calculated 5,462 feet. The actual flight reached 5,504 feet AGL, putting RocketPy within just 42 feet of the real result. We also used RasAero to study how different surface finish assumptions affected performance. Simulating smooth, painted, and rough painted finishes produced apogee variations ranging from 5,457 feet to 5,462 feet, giving us valuable insight into how real-world manufacturing tolerances might impact our L3 rocket.
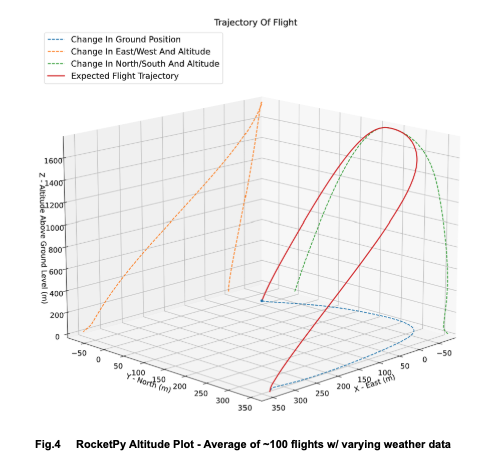
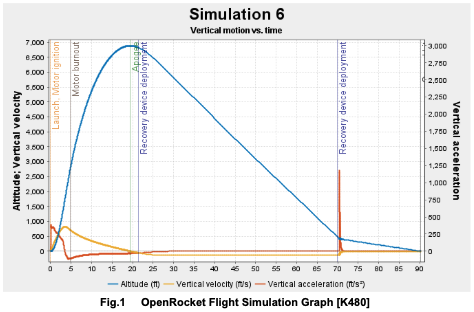
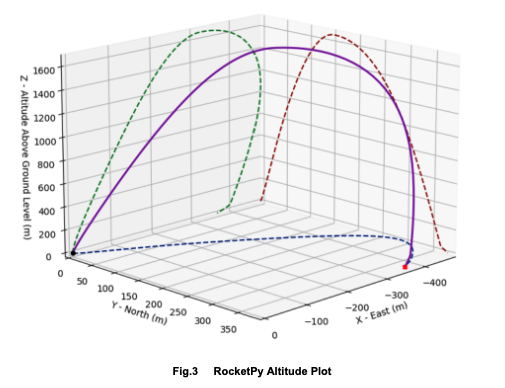
Once we were confident in our methods, we moved on to simulating the L3 rocket design, using insights from both RocketPy and RasAero to refine stability margins and predicted apogee. After completing the initial six-degree-of-freedom (6-DOF) simulations for both ETR and our L3 rocket, and waiting for each respective launch day, we began work on recovery simulations. This involved learning to run Monte Carlo analyses and incorporating weather data into our software to better account for real-world variability on launch day. Finding real-world, open-source weather data for our specific launch sites was sometimes challenging, but we were able to pull information from sources like NOAA and the University of Wyoming to feed into our models. Because we had a limited number of test launches, these simulations became especially critical to our preparation. To address this, we ended up developing a local application that could run on our devices and be brought directly to launch sites, allowing us to input the current day-of weather conditions onsite and update our predictions in real time.
Conclusion
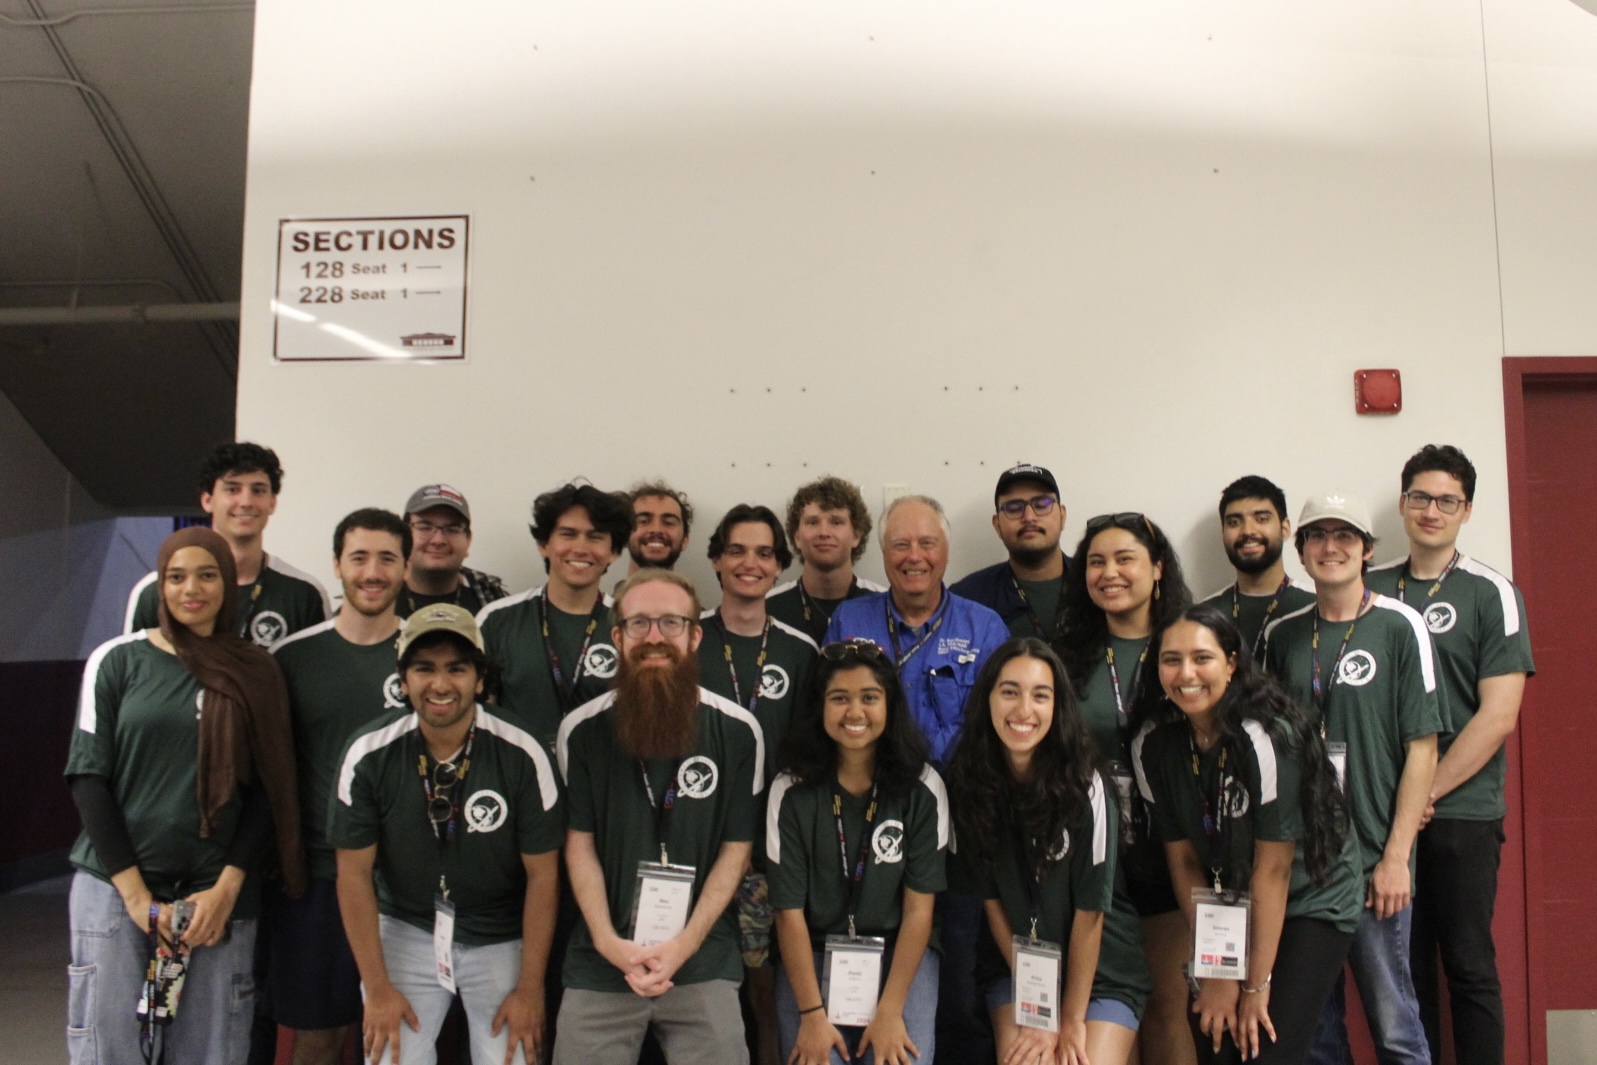
The week of the competition, we drove out to Spaceport America, New Mexico. During competition week, we took the opportunity to meet and
connect with rocketry teams from all over the world (spanning six continents)! It was really interesting getting to see how many different
approaches and innovations teams brought to the field (literally met a team that had a payload you could play Doom on), genuinely learning
so much just from walking the flight line and talking with fellow competitors.
On launch day, after months of preparation, simulation, and hard work, we were able to successfully launch and recover our rocket,
ultimately achieving mission success. It was an incredibly rewarding moment, and I've never been more proud to have gotten to contribute
to and be a part of such an amazing team of bright young engineers. <3
Gallery

bp Internship Project; Variational Quantum Eigensolver Implementation for H2
Jun-Aug 2023 | Qubit x Qubit / British Petroleum
bp Manager: Clena Abuan | QxQ Advisor: Gabbbie Meis
Overview
As an "Early Quantum Career Immersion Program" Intern (EQCI) with QxQ and bp, I had several projects and quantum algorithms I implemented throughout the course of my internship. One of my internship projects with bp included researching potential uses of the Linear Formulation and Quadratic Unconstrained Binary Formulation of the Unit Commitment Problem with regards to energy market operation. Additionally, I was tasked with writing a separate paper on another algorithm of interest and create a short prototype of said algorithm. I chose to study and implement the Variational Quantum Eigensolver.
VQE Applications
VQE is a hybrid quantum-classical algorithm designed to find the ground state energy of a quantum system (like a molecule or a material). It answers: "What is the lowest possible energy configuration of this system?" VQE's value lies in improving the physical assets that participate in the market. Better assets lead to better market positions. By simulating better molecular structures, the impacts range from optimized battery chemistry and storage, cheaper green fuel options, better carbon-capture solvents, simulating high-temperature superconducitor materials, and much more.
For my project I chose to examine the the VQE algorithm with regards to calculating the energy of molecular Hydrogen (H2), one of the current most popular alternatives to methane. However, this is only one example of a molecule we can utilize VQE to understand. We can extend this tool to understand molecules involved across the energy sector including in solar cell materials, battery components, carbon capture, hydrogen storage, and virtually any chemical application, saving time, money, and resources. Here we can see an example of VQE finding the electronic structure of H2 with varying Angstrom distances between atoms.
Algorithm Implementation Overview
- 1. Convert a molecule into a ‘QMolecule’ with varying distances between the H atoms.
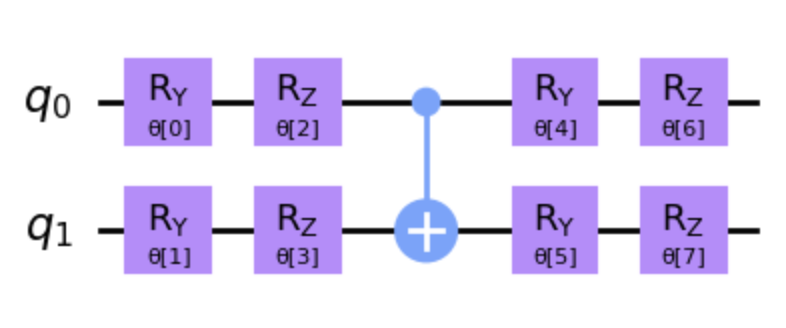
- 2. Define a tunable circuit using ‘EfficientSU2’, mapping atoms to qubits where each qubit represents the state of an atom or particle. We also use the classical optimizer algorithm ‘COBYLA’ that employs linear approximations to objective and constraint functions.
- 3. Find the total energy through both VQE and an exact solver (to verify results) in addition to calculating percent error.
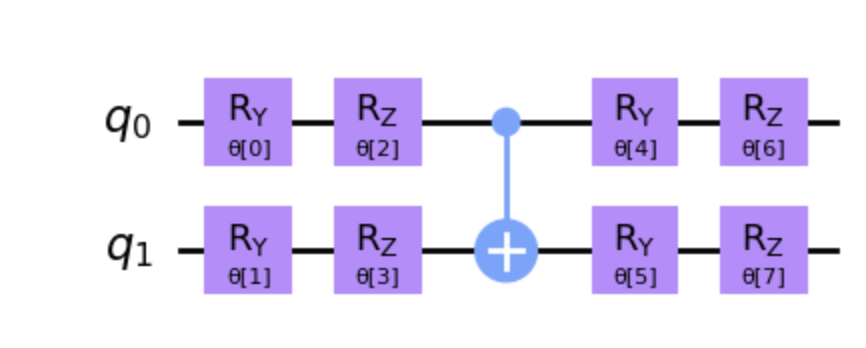
Tunable Circuit
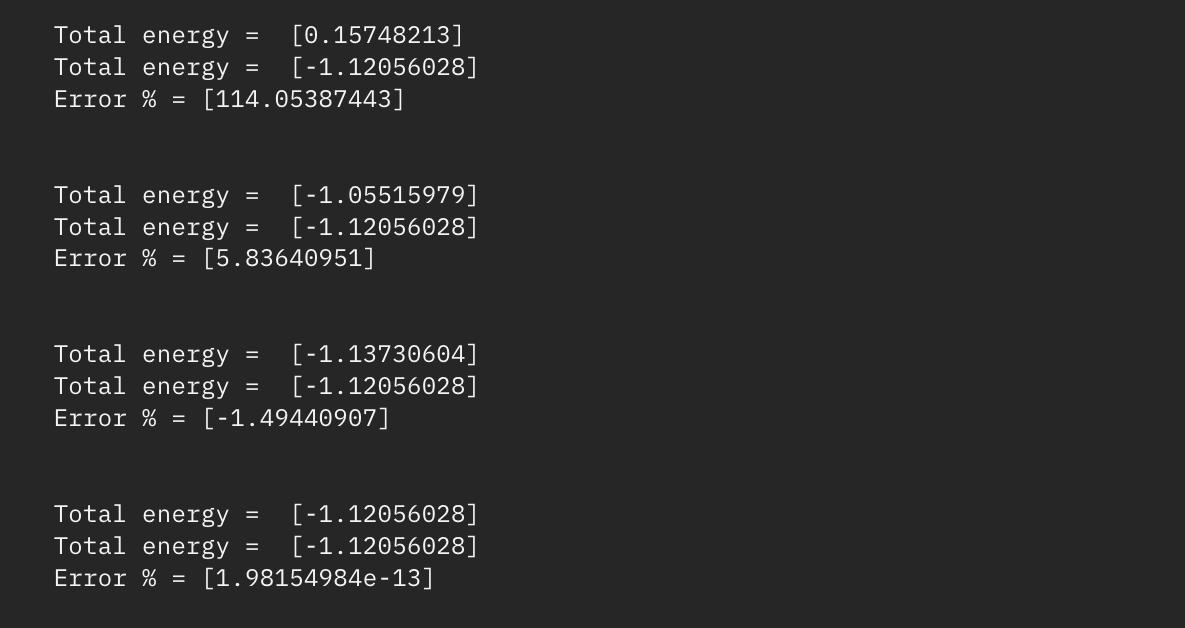
Total energies using vqe and exact solver w/percent error
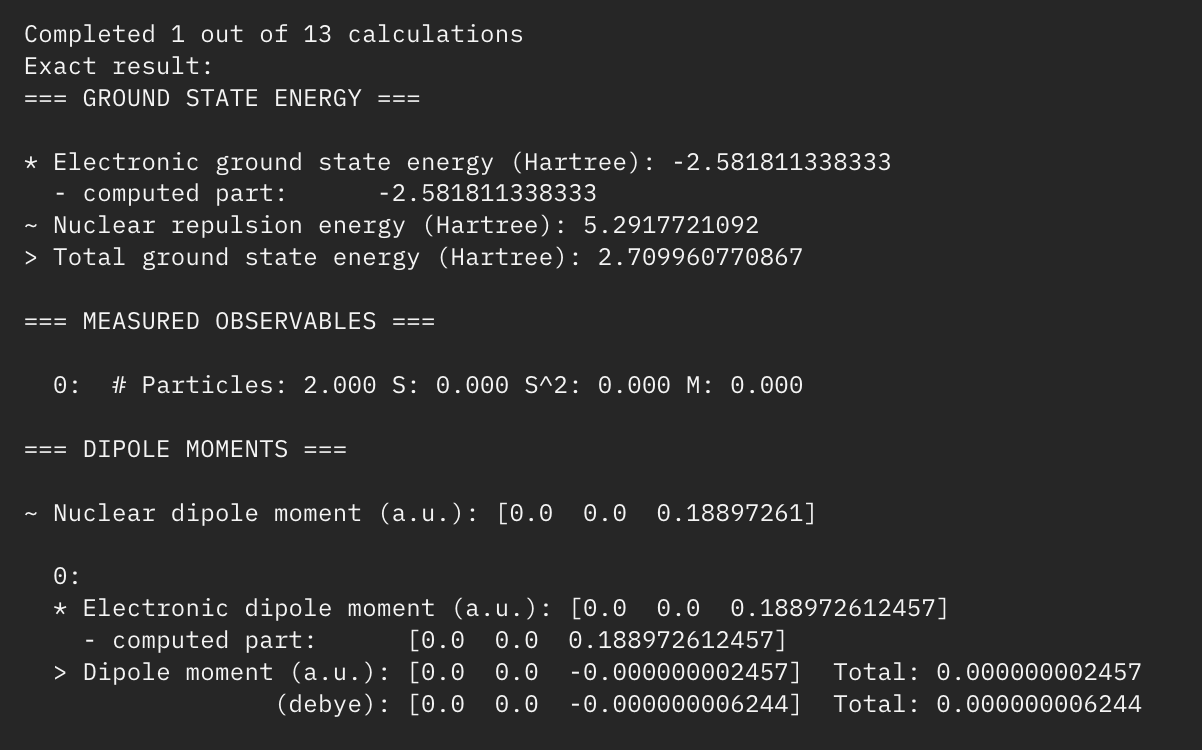
Total energies using vqe and exact solver w/percent error
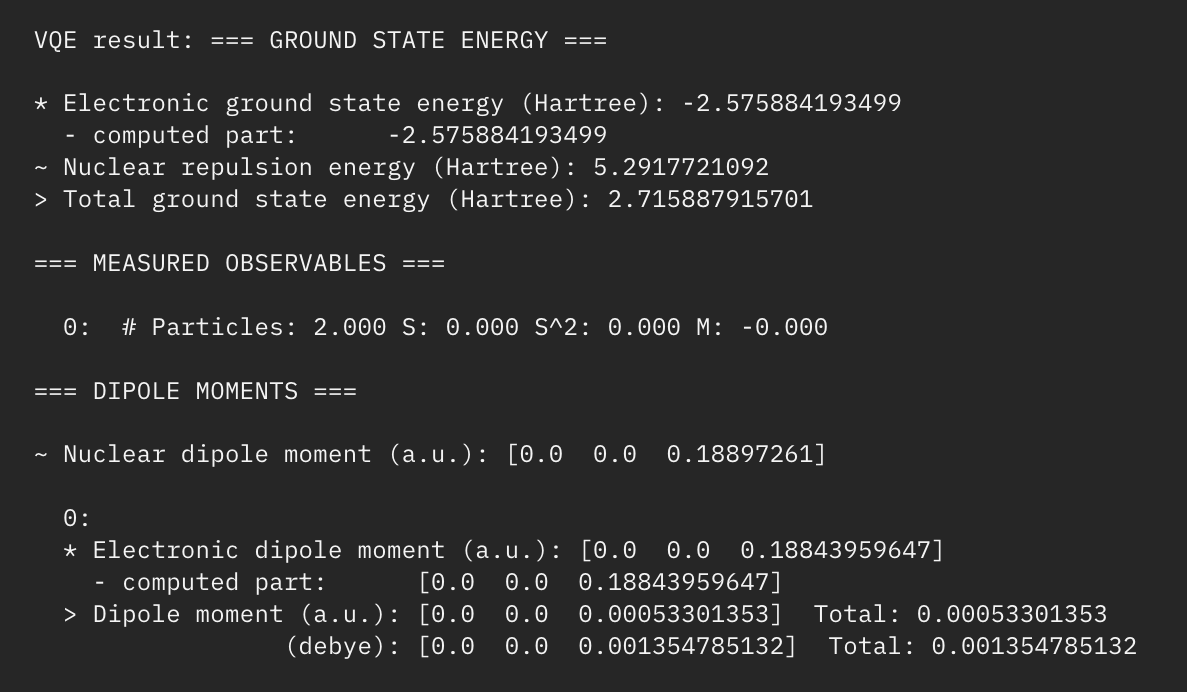
Total energies using vqe and exact solver w/percent error
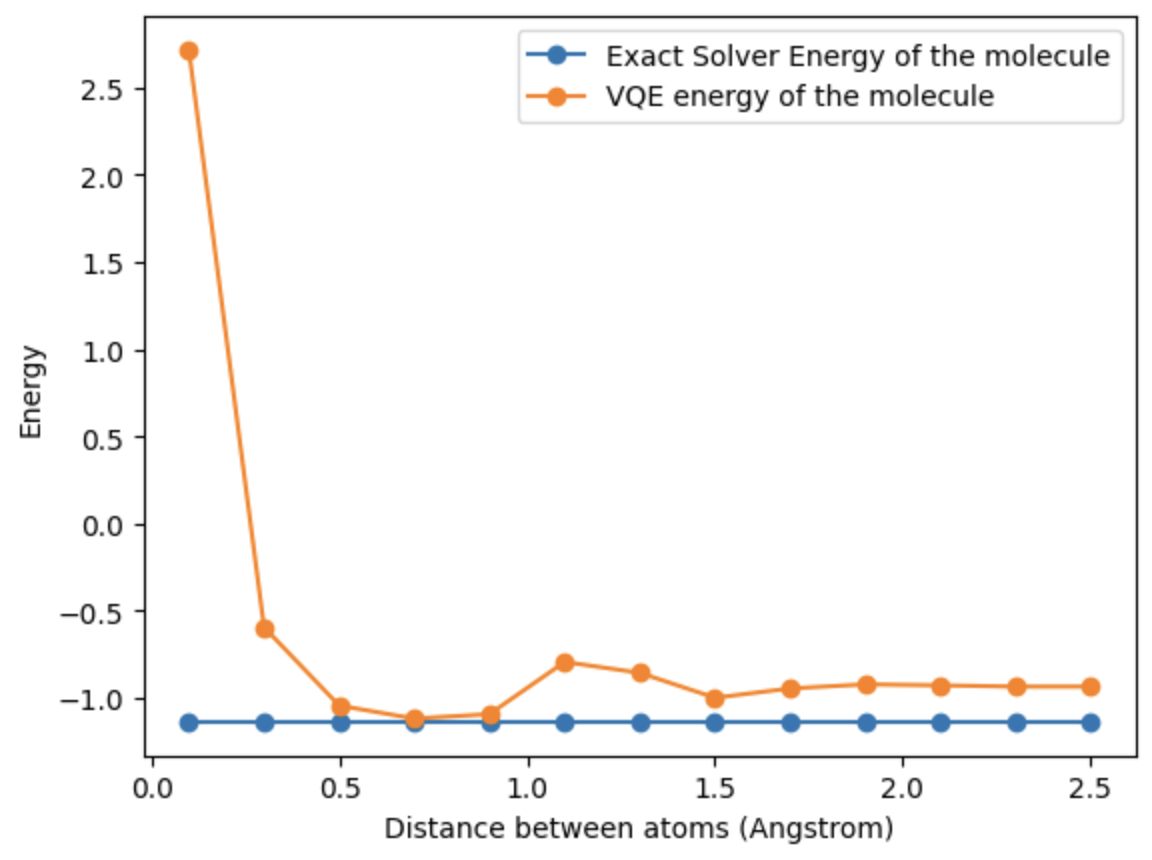
Visualization of Exact Solver vs. VQE methods
Conclusion
Through analysis of the results shown above, we can see the relative accuracy and time it takes for VQE to reach the optimal solution/energy compared to the exact solver. Now imagine using this method with much more complicated molecules with far more atoms than H2.
While VQE has shown immense promise, there are some limitations we have to consider such as available quantum resources, circuit complexity, error mitigation, and scalability. However, as we begin to improve both quality and quantity regarding quantum hardware, the prospects of VQE continue to grow.
By finding the ground state of a molecule, we’re able to gain a better understanding of its behaviors and properties, allowing us to make informed decisions when creating applications of interest. This not only applies to the energy sector but also to industries such as pharmaceutical development, material science, and so much more, furthering our understanding of the world around us.
Tech Stack
Programming Language
Quantum Python Library
Web-based IDE
QxQ Internship Project; Ekert 91 Quantum Key Distribution Implementation
May-Aug 2023 | Qubit x Qubit
QxQ Advisor: Gabbbie Meis
Overview
At the end of my Qubit by Qubit internship, the final project brought everything together: I worked in a small group during the last week of classes to dive into an advanced quantum topic and build a working implementation from the ground up. The challenge was to write clean, well-commented code for something like a protocol, simulation, or error correction scheme without relying on pre-built quantum functions for that specific concept (e.g., no using Qiskit’s built-in VQE). Basic tools like gates, NumPy, and random libraries were fine, which meant we focused on truly understanding the underlying math and logic.
We capped off the week with a 10–15 minute presentation to our peers, explaining the concepts, walking through our code, demonstrating a live solution to a concrete problem, and discussing what we would explore next with more time. It was a rigorous but rewarding way to apply everything I learned during the internship.
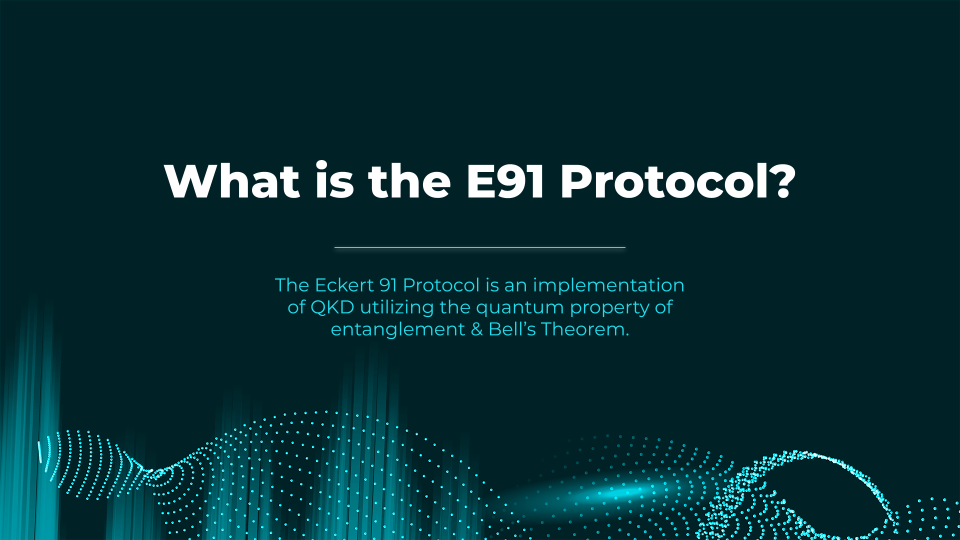
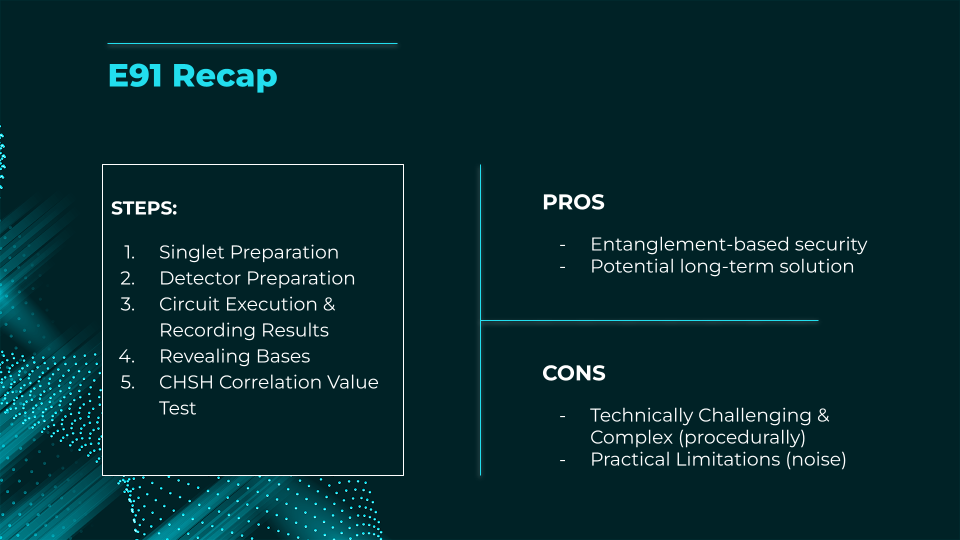
Brief Explanation of the E91 QKD Protocol
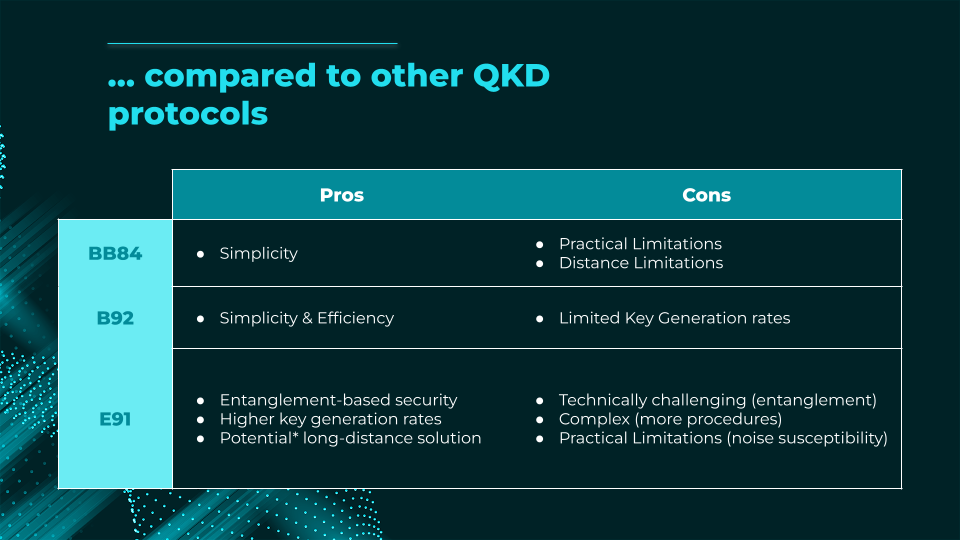
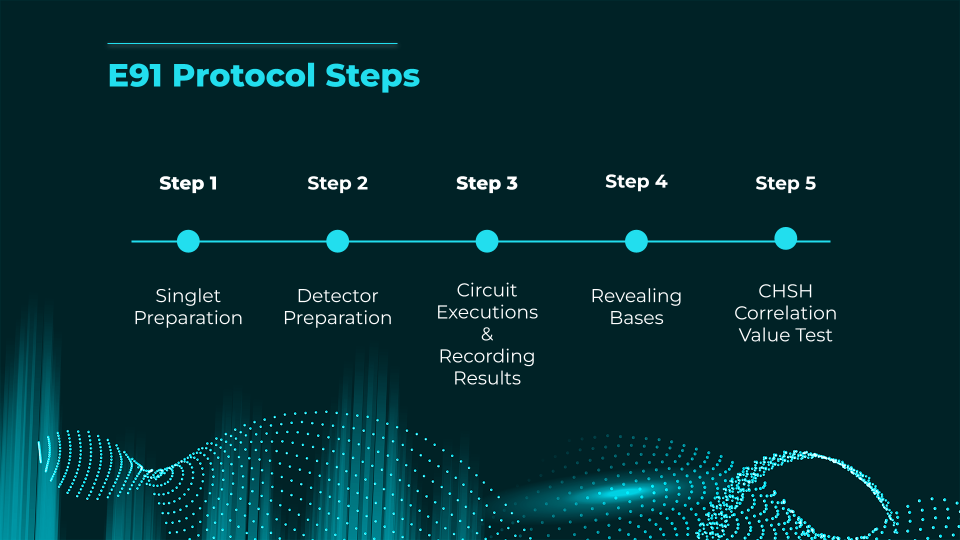
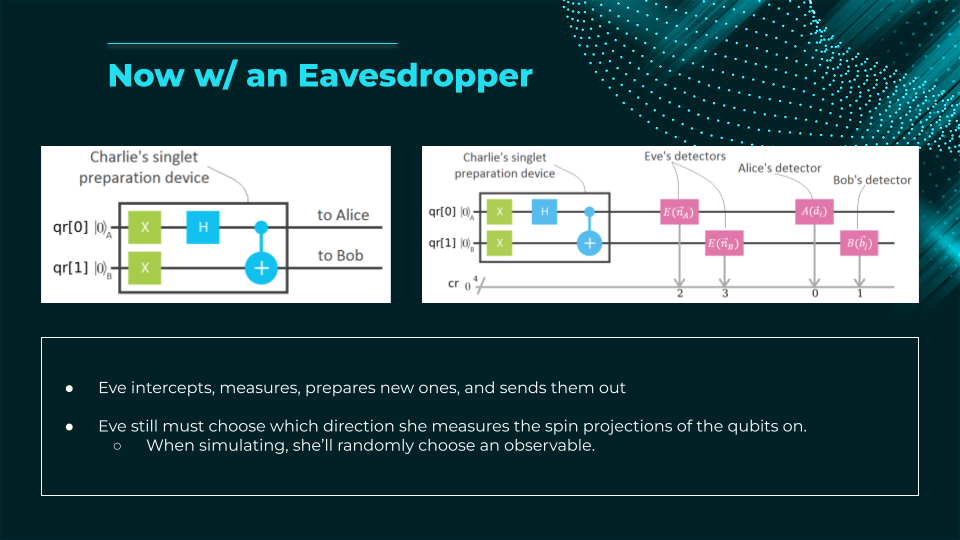
The E91 protocol (Ekert, 1991) is a quantum key distribution scheme that uses entangled particle pairs to securely generate a shared random key between two parties (Alice and Bob). Unlike BB84, security is based on Bell’s inequality:
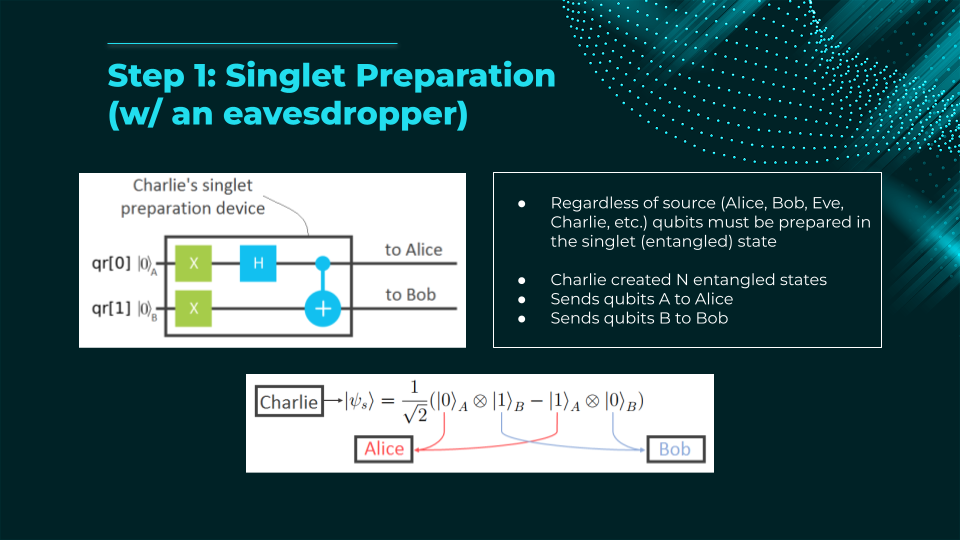
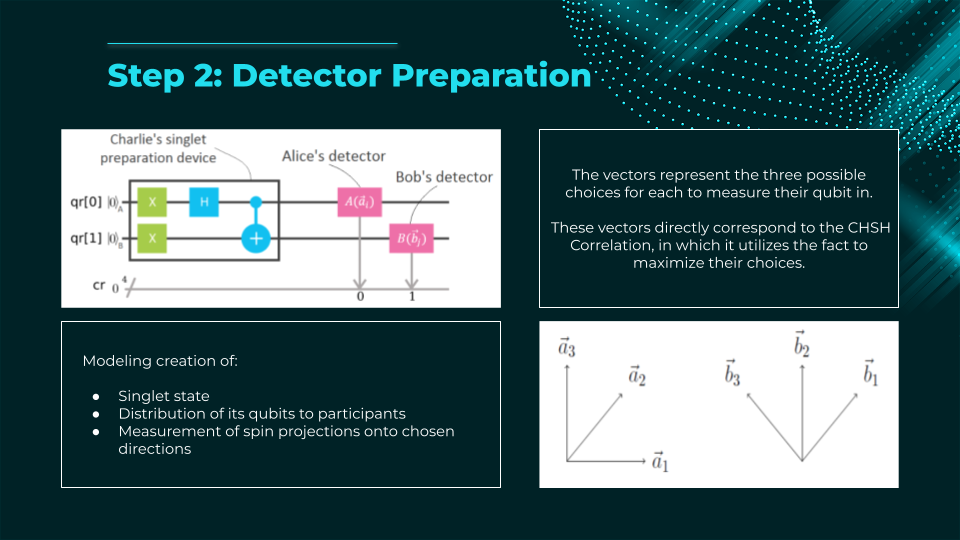
- A source generates entangled qubits (e.g., Bell pairs) and sends one qubit to Alice, the other to Bob.
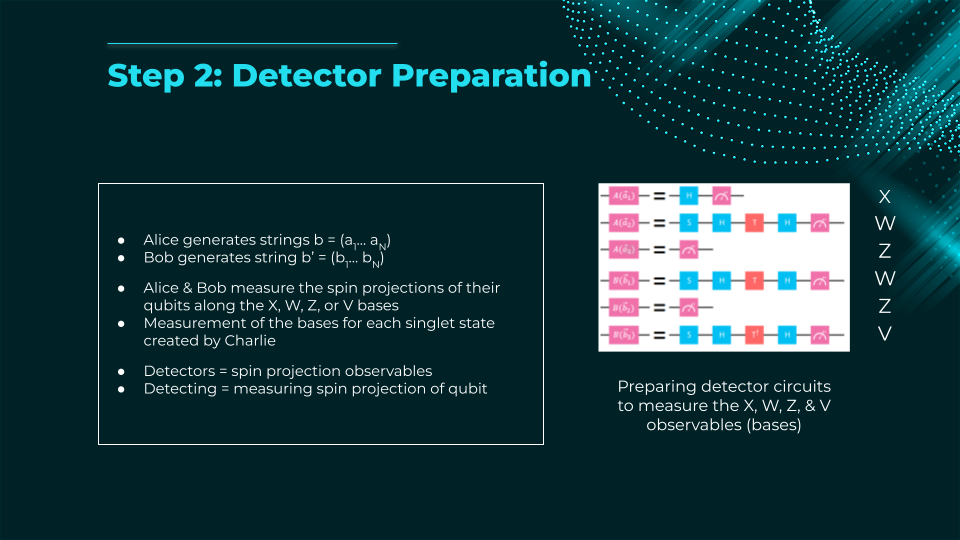
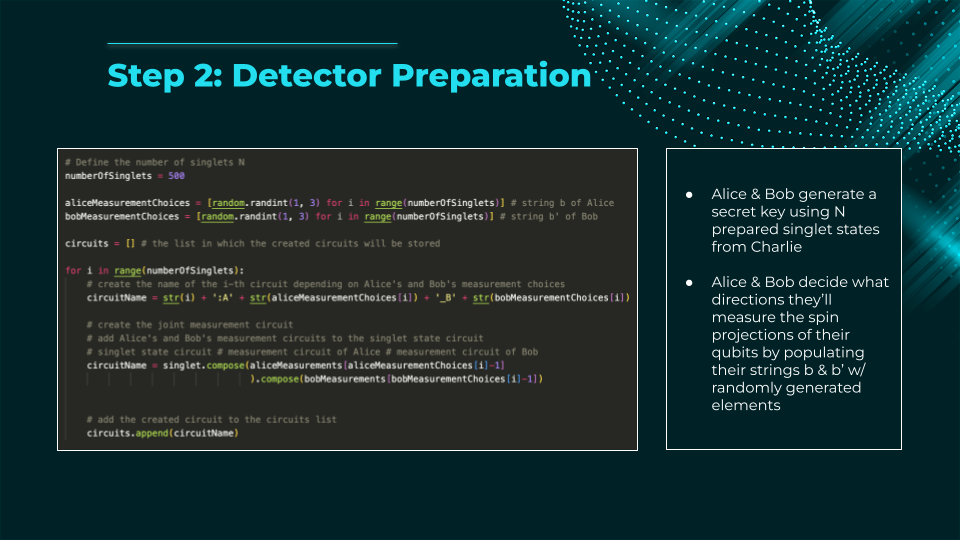
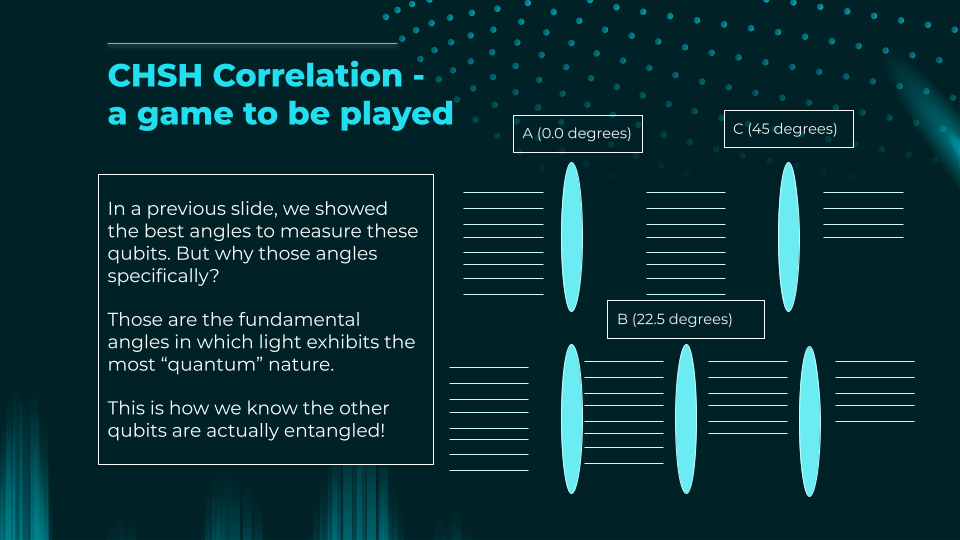
- Each party randomly measures their qubit in one of several bases (e.g., two or three different bases on the Bloch sphere).
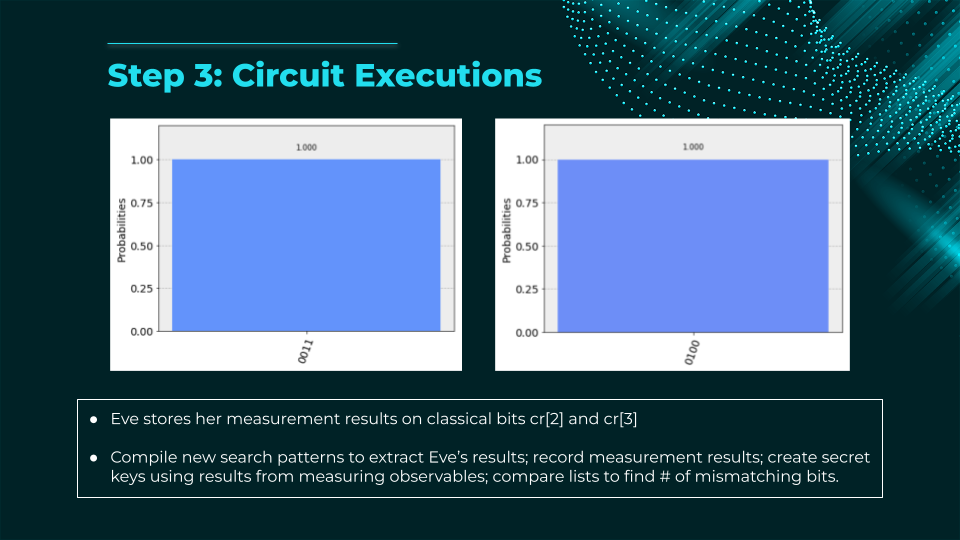
- After the measurements, they publicly compare a subset of results to test for Bell inequality violations.
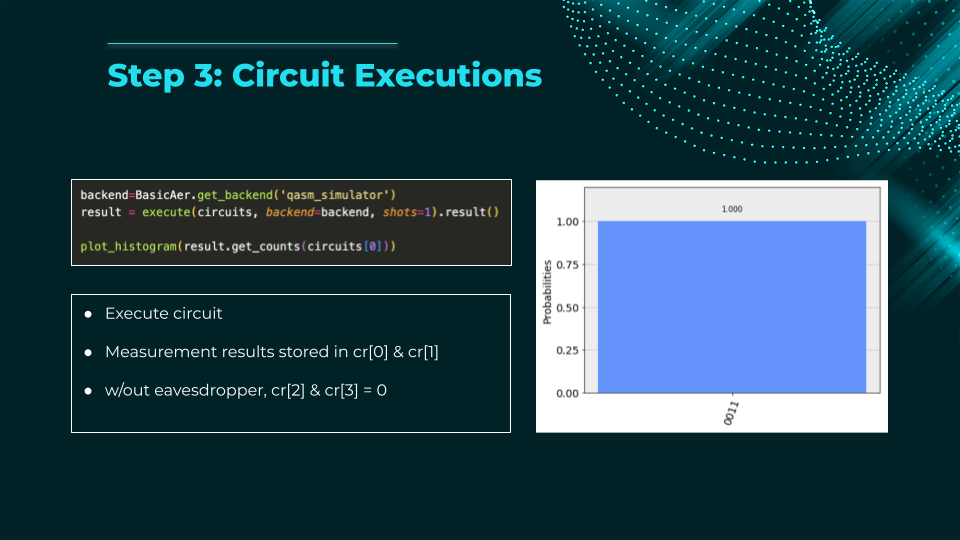
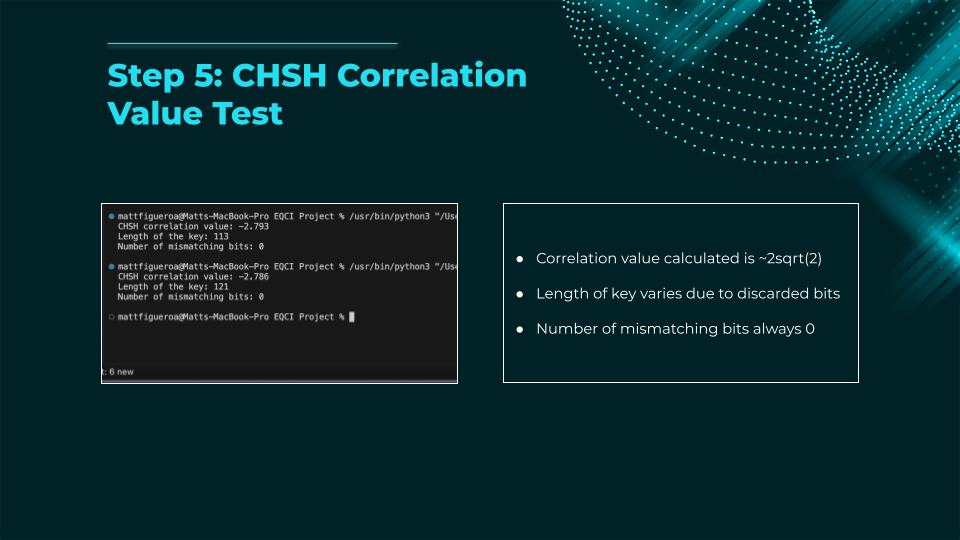
- If the violation matches predictions for quantum mechanics (no eavesdropping), they can be confident no third party (Charlie) has intercepted the qubits. The remaining measured bits become the secret key.
- If the inequality is not violated enough, an eavesdropper is present → discard key.
Key advantage: E91 detects eavesdropping via fundamental quantum correlations rather than just basis mismatch, offering a different security proof approach than prepare-and-measure protocols.
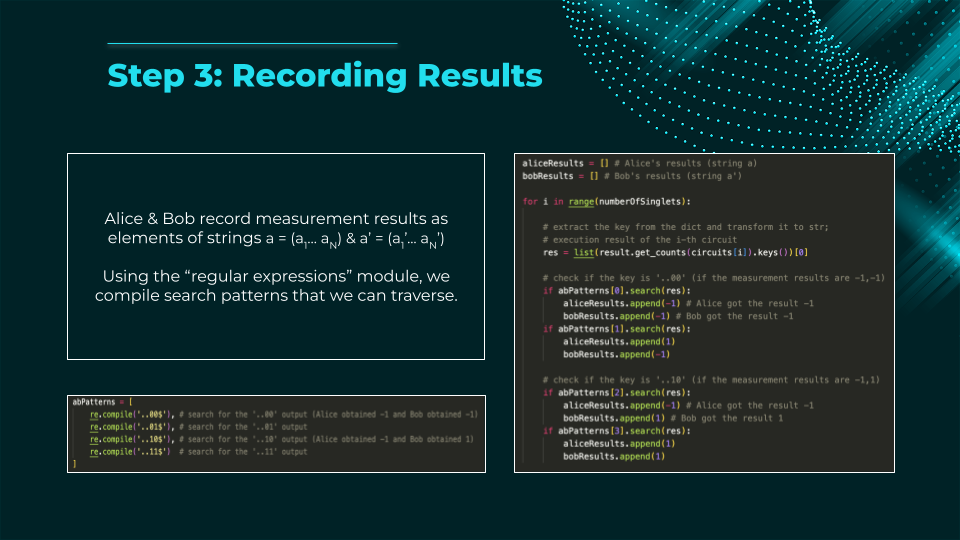
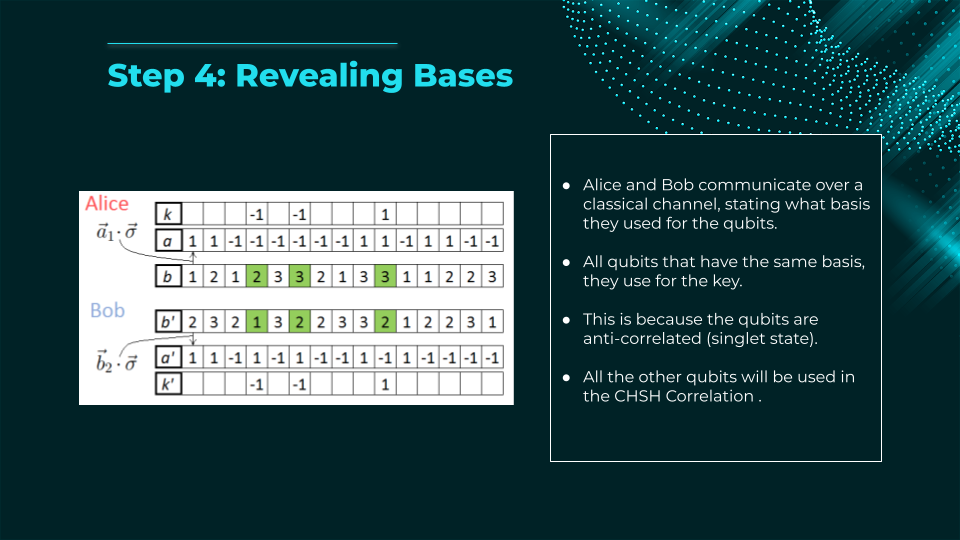
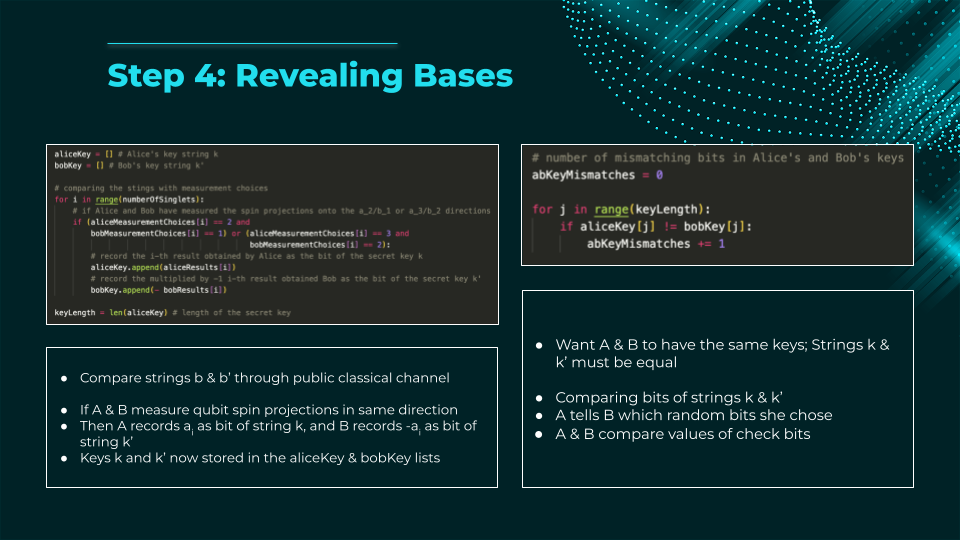
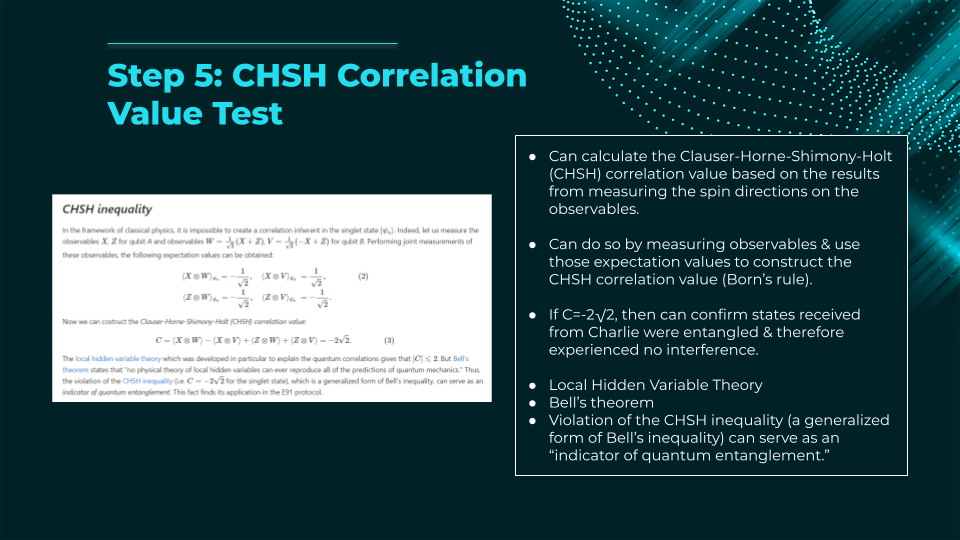
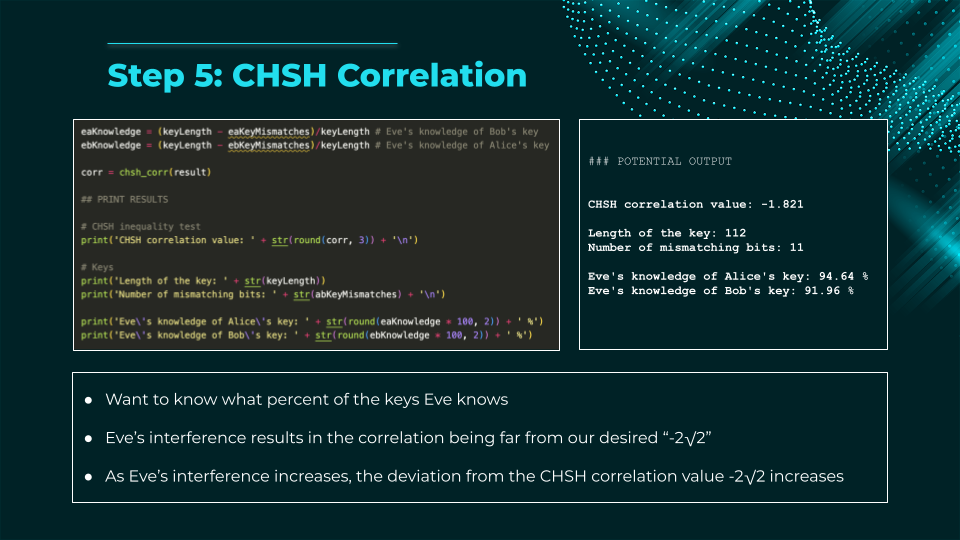
Final Presentation Slides

Tech Stack
Programming Language
Quantum Python Library; Qiskit Version: 2.2.1
Web-based IDE